Sony A7S DR-Pix Read Noise
Prepared 2014-12-14, last revised 2015-09-04 by Bill Claff
In September of 2010 Aptina introduced an APS-C format 16MP
image sensor called the MH9H004. I'm not aware that the MH9H004 was ever used
in a consumer DSLR. At that time Aptina published a white paper [Hosted locally by
permission.] explain the DR-PIX technology. It does appear that this DR-Pix
technology, or functionally identical technology, is used in the Sony A7S
sensor.
If you don't want to read the entire white paper then
concentrate on the right hand side of Page 5 above and below Figure 5.
If you don't read the white paper at all; simply understand that it introduces the
concept of dual conversion gains in the pixel rather than just one.
The result is two ranges of analog conversion gain; Aptiva
calls these Low Conversion Gain (LCG) and High Conversion Gain (HGC).
By using LCG at low ISO settings and HGC at high ISO settings a high Dynamic
Range (DR) can be maintained over a larger range of ISO settings than
conventional technology.
I think this concept will take hold and is great news for
photographers; but it complicates the work of people, like myself, in trying to
characterize sensors.
This article outlines a read noise model that incorporates dual (or multiple)
conversion gain values in the pixel.
Characterizing Read Noise
Read noise data are often presented in tabular form for
different ISO settings; but this is not necessary.
Over the entire analog only range of ISO settings, read noise can be
characterized by two values.
I haven't found any consistent terms used to refer to these values..
I have been calling them pixel read noise and ADC noise; but think that input
noise and conversion noise might be better choices.
The key noise equation looks like this:
output_noise = sqrt((input_noise * conversion_gain)^2 +
conversion_noise^2) "the
equation"
Now with multiple conversion gain stages we have to consider that the
output_noise of one stage is the input_noise of the next.
The Sony A7S
I'll present my Sony A7S
findings and illustrate them with an ISO setting from each of the two
conversion gain ranges.
For this article I'm using 14-bit values.
[The previous revision used only the Gb channel and the solution was a less
perfect fit.]
The normal conversion gain range
is from ISO 125 up to and including ISO 1600; Aptiva calls this LCG mode.
The second conversion gain range is from ISO 2000 up to and including ISO 25600;
Aptiva call this HCG mode.
The input noise at the pixel is 0.920e- and the conversion noise at the pixel
is 3.441e-.
For the LCG range the conversion gain is 1 and the pixel output noise is
3.562e-.
For the HCG range the conversion gain is 16 and the pixel output noise is
15.117e-.
Note that signal in HGC mode is 16x LCG mode but noise in HGC mode is a little
less than 4x LCG mode.
At ISO 200 the input noise is 3.562e- from above, the conversion gain is
0.198DN/e- and the conversion noise is 2.653DN; the resulting output noise is
2.745DN.
At ISO 3200 the input noise is 15.117e- from above, the conversion gain is 0.198DN/e- and the conversion noise is 2.653DN; the resulting output noise is 4.004DN.
Note that the conversion gain
values are the same because the input
signal at ISO 3200 was already amplified 16x at the pixel.
The unity gain value for the A7S is 1024; so (203 / 1) / 1024 = (3251 / 16) /
1024 = 0.198
(Note I'm using the "exact" ISO values rather than the nominal.)
Naturally the conversion noise of 2.653DN is constant across both analog
ranges, LCG and HCG.
This table summarizes the
calculations for all of the ISO settings:
|
|
model |
measured |
||||||
|
ISO |
pixel |
conversion |
conversion |
intermediate |
conversion |
conversion |
read |
read |
|
Setting |
noise |
gain |
noise |
noise |
gain |
noise |
noise |
noise |
|
|
e- |
e-/e- |
e- |
e- |
DN/e- |
DN |
DN |
DN |
|
125 |
0.920 |
1 |
3.441 |
3.562 |
0.125 |
2.653 |
2.690 |
2.710 |
|
160 |
0.920 |
1 |
3.441 |
3.562 |
0.157 |
2.653 |
2.712 |
2.620 |
|
200 |
0.920 |
1 |
3.441 |
3.562 |
0.198 |
2.653 |
2.746 |
2.700 |
|
250 |
0.920 |
1 |
3.441 |
3.562 |
0.250 |
2.653 |
2.798 |
2.800 |
|
320 |
0.920 |
1 |
3.441 |
3.562 |
0.315 |
2.653 |
2.880 |
2.990 |
|
400 |
0.920 |
1 |
3.441 |
3.562 |
0.397 |
2.653 |
3.006 |
3.120 |
|
500 |
0.920 |
1 |
3.441 |
3.562 |
0.500 |
2.653 |
3.195 |
3.030 |
|
640 |
0.920 |
1 |
3.441 |
3.562 |
0.630 |
2.653 |
3.475 |
3.220 |
|
800 |
0.920 |
1 |
3.441 |
3.562 |
0.794 |
2.653 |
3.877 |
3.530 |
|
1000 |
0.920 |
1 |
3.441 |
3.562 |
1.000 |
2.653 |
4.441 |
4.550 |
|
1250 |
0.920 |
1 |
3.441 |
3.562 |
1.260 |
2.653 |
5.213 |
5.370 |
|
1600 |
0.920 |
1 |
3.441 |
3.562 |
1.587 |
2.653 |
6.246 |
6.290 |
|
2000 |
0.920 |
16 |
3.441 |
15.117 |
0.125 |
2.653 |
3.257 |
3.200 |
|
2500 |
0.920 |
16 |
3.441 |
15.117 |
0.157 |
2.653 |
3.564 |
3.610 |
|
3200 |
0.920 |
16 |
3.441 |
15.117 |
0.198 |
2.653 |
4.004 |
3.940 |
|
4000 |
0.920 |
16 |
3.441 |
15.117 |
0.250 |
2.653 |
4.617 |
4.440 |
|
5000 |
0.920 |
16 |
3.441 |
15.117 |
0.315 |
2.653 |
5.451 |
5.730 |
|
6400 |
0.920 |
16 |
3.441 |
15.117 |
0.397 |
2.653 |
6.560 |
6.840 |
|
8000 |
0.920 |
16 |
3.441 |
15.117 |
0.500 |
2.653 |
8.011 |
8.150 |
|
10000 |
0.920 |
16 |
3.441 |
15.117 |
0.630 |
2.653 |
9.886 |
10.340 |
|
12800 |
0.920 |
16 |
3.441 |
15.117 |
0.794 |
2.653 |
12.288 |
12.620 |
|
16000 |
0.920 |
16 |
3.441 |
15.117 |
1.000 |
2.653 |
15.348 |
15.640 |
|
20000 |
0.920 |
16 |
3.441 |
15.117 |
1.260 |
2.653 |
19.230 |
19.320 |
|
25600 |
0.920 |
16 |
3.441 |
15.117 |
1.587 |
2.653 |
24.143 |
23.430 |
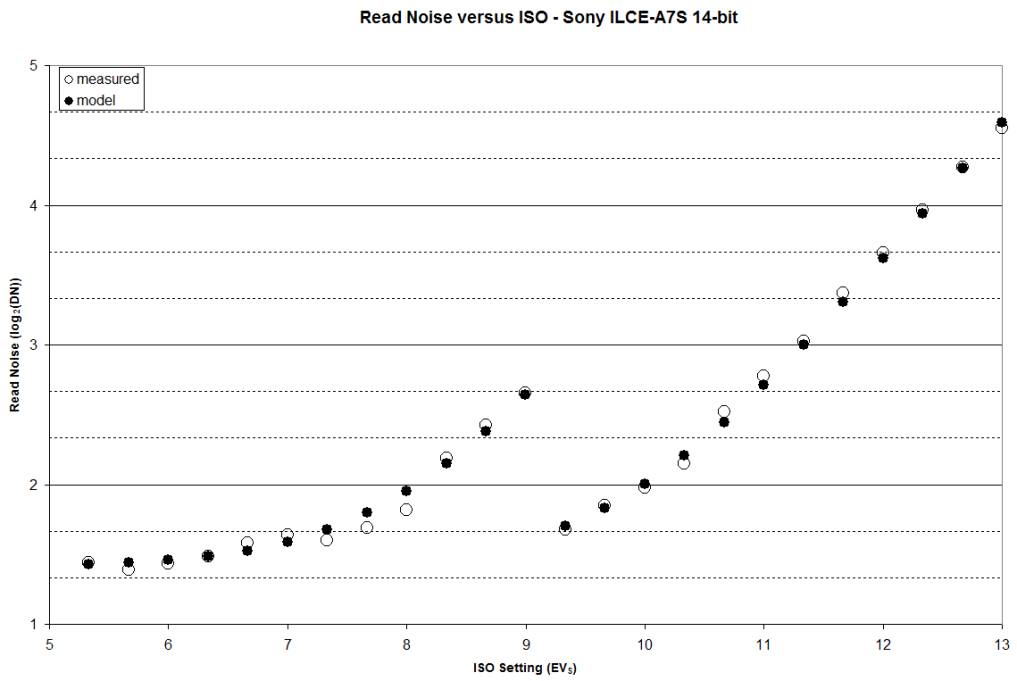
You can see by examining the table or the following chart that the model read
noise and the measured read noise agree quite well.
(This is a log-log chart and the small discrepancies are generally well within
a 1/6EV tolerance.)
Conclusion
I have demonstrated that to characterize read noise of the A7S, incorporating DR-Pix technology, that only three values are required: 0.920e- pixel noise, 3.441e- pixel conversion noise, and 2.653DN ADC conversion noise. (And unity gain of 1024 to compute the conversion gains to feed in.)