Prepared 2014-10-30
by Bill Claff
Revised 2012-10-31
ISO Sensitivity
DxOMark measures ISO Sensitivity according to this definition and testing protocol.
Although there is a wealth of information on the DxOMark site, the details of the data collection are unclear and the underlying data is not reported.
Never the less, the testing scenario is likely as follows:
One or more sets of images are taken using the 13-step noise and transmission
target.
Exposure at the focal plane is known by careful measurement and by the known
optical densities of the noise and transmission target.
Sensor saturation is measured by processing the central portion of the raw
image data.
The ISO Standard 12232 definition that ISO Sensitivity is ![]() where S is
Sensitivity and H is luminance is used.
where S is
Sensitivity and H is luminance is used.
Taking advantage of the linear response of the sensor; the
multiple data points are used to accurately estimate ![]() and therefore
and therefore ![]() , the measured ISO
, the measured ISO
ISO Measurements as Confirmation of Linearity of Gain
We expect measured ISO to be linear with respect to the ISO setting on the camera (DxOMark calls this the Manufacturer ISO).
I performed fits against the DxOMark data and confirmed this.
The fits can be viewed on my Measured ISO
Chart where you can see the amount of shift and compare multiple cameras.
How Measured ISO Compares to Manufacturer ISO
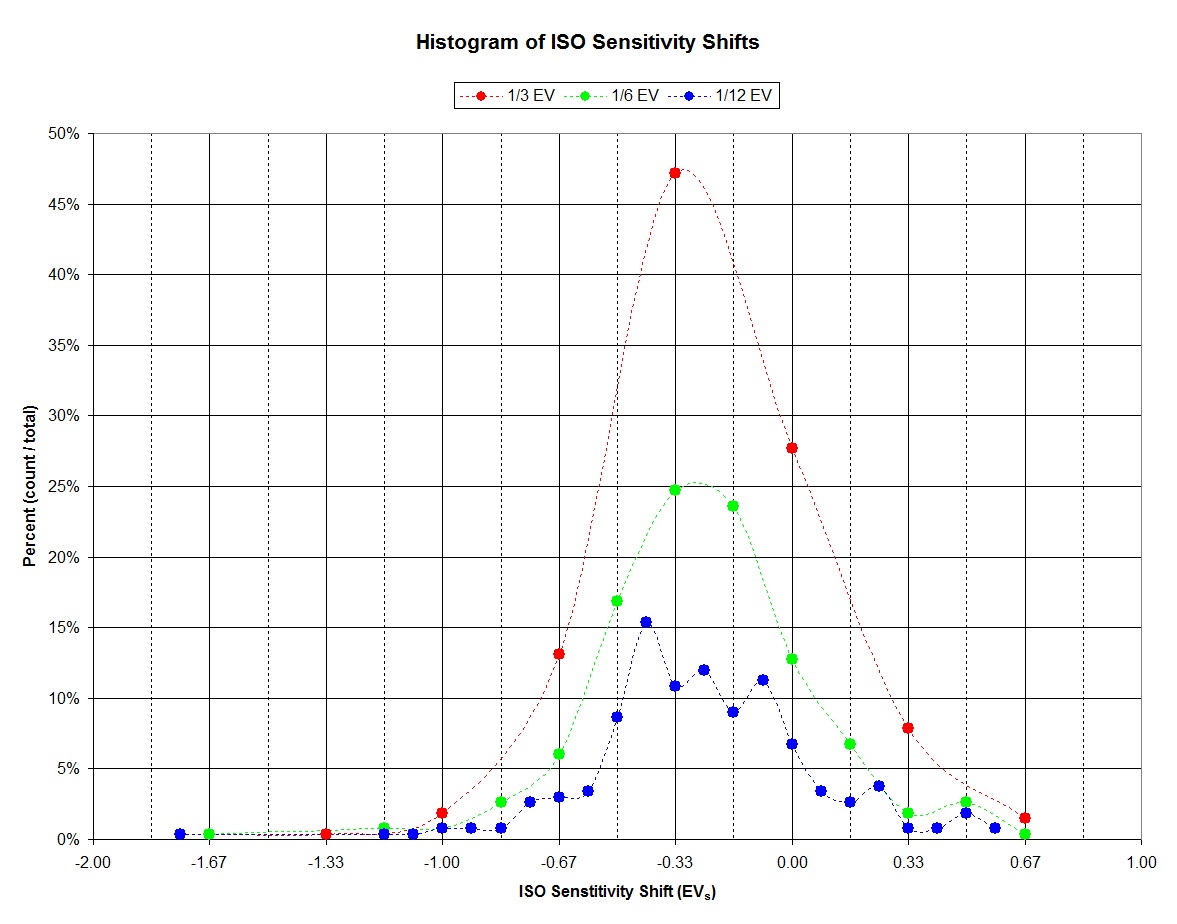
I call the difference between the ISO setting and the measured
ISO the sensitivity shift.
For example, a shift of -0.33 means that the camera sensor records light as if
ISO were 1/3 stop lower than the ISO setting.
I binned the differences to the nearest 1/3, 1/6, and 1/12 EV to analyze the
trend.
The majority of the cameras have a negative sensitivity shift; and that shift is strongly centered about -0.33 EV.
This can complicate technical comparisons between different
camera sensors.
I suspect this has more to do with allowing for highlight headroom than some
conspiracy to falsify ISO settings.