Chart
Primer
Prepared 2015-08-13 by Bill Claff, last revised 2015-08-20
The purpose of this documentation is to illustrate the various features of the charts so as to make them more useful to you.
Generally
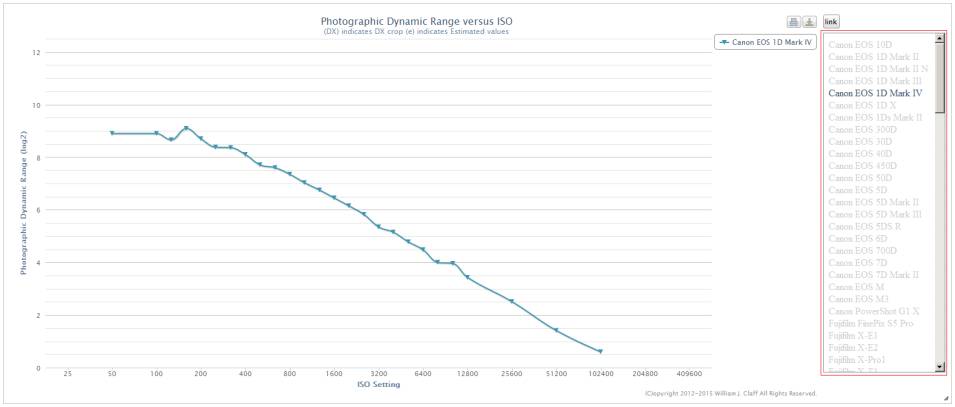
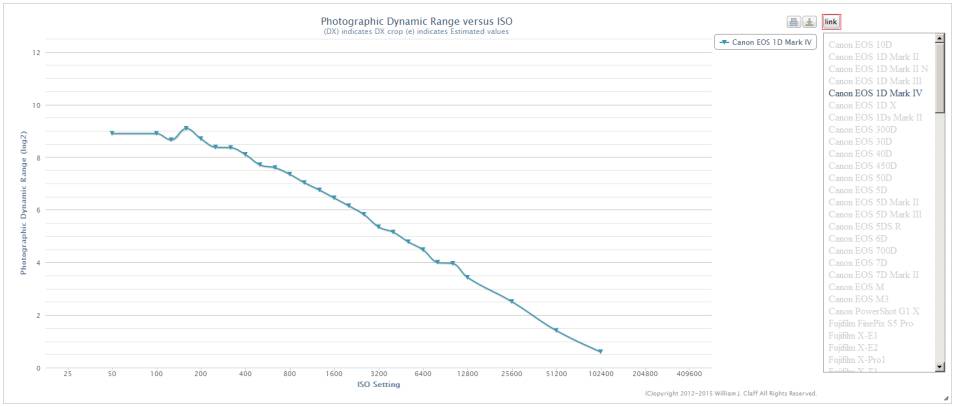
there will be a scrollable alphabetical camera model list on the right hand
side of the chart:
Toggle
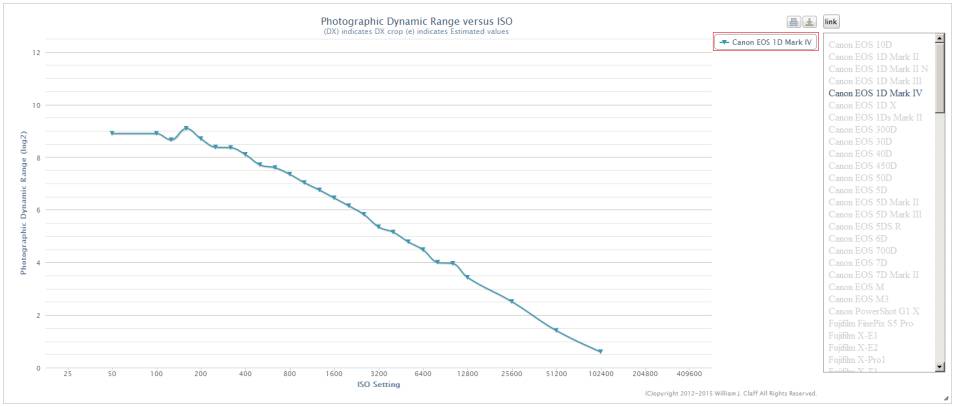
the desired cameras on or off using the camera model list. The data will be
displayed and the selected camera models show as bold and in the legend:
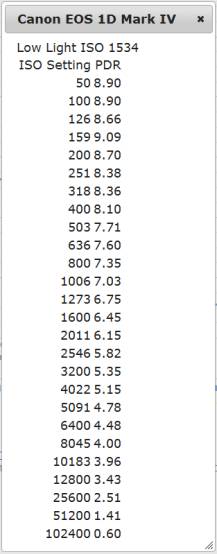
Clicking on a camera model in the legend will often display additional data:
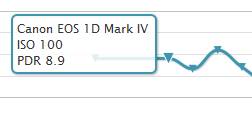
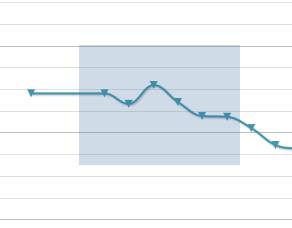
Hovering
over the chart will also provide more detailed information on specific data
points:
Generally,
you can use the mouse to select a rectangle to zoom in on a selction of the
chart:
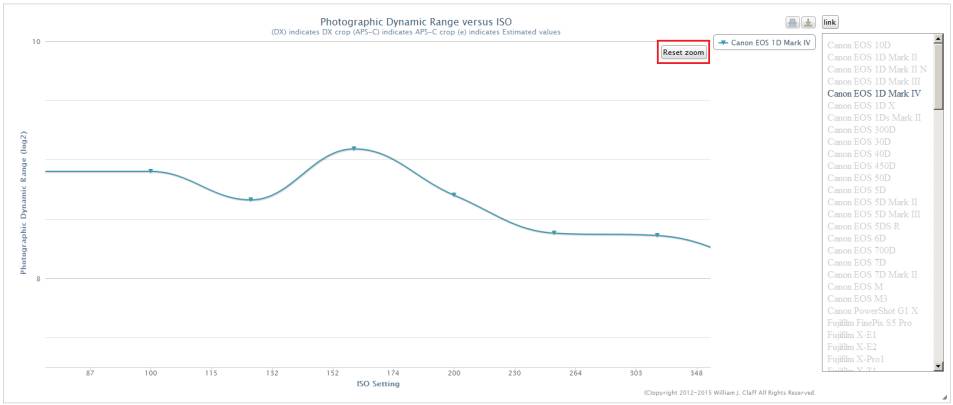
Note that when zoomed in there is a Reset zoom button to return the chart to
its normal state:
The
print button allows you to print the chart:
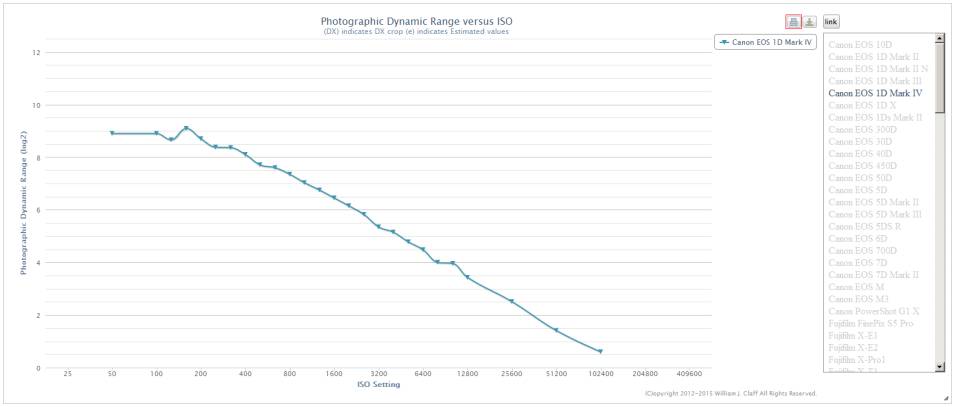
Note that only the chart shows while the print dialog box is displayed:

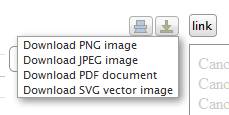
The
export button is a great way to take a "screen shot":
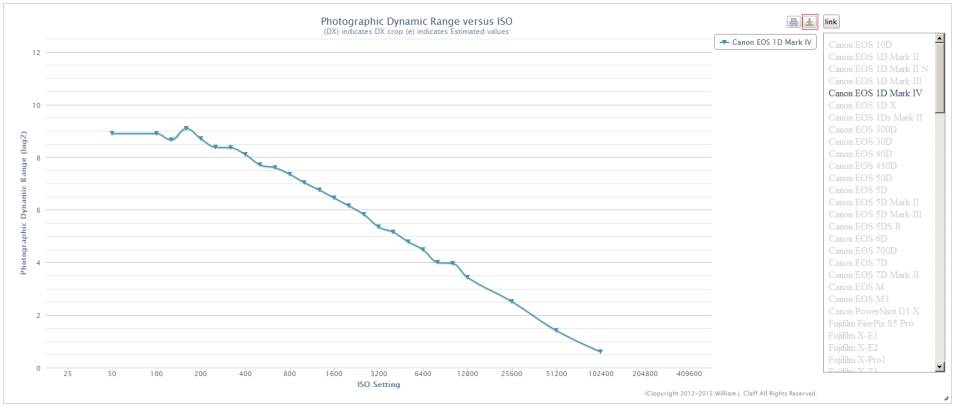
I generally choose png for my output:
The
link button is the ideal way to return to the chart with the current selections
intact:
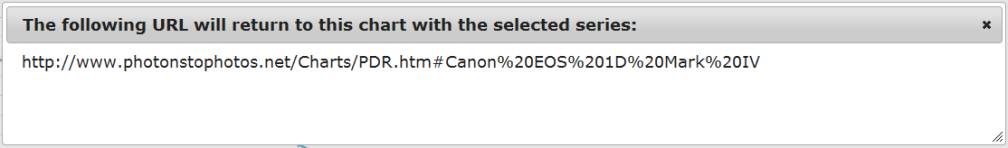
Try
to provide a link back to the chart whenever you post a screen shot.
This gives your audience the opportunity to interact with the chart.
There
is often additional information below the chart.
For example, a table may be present:
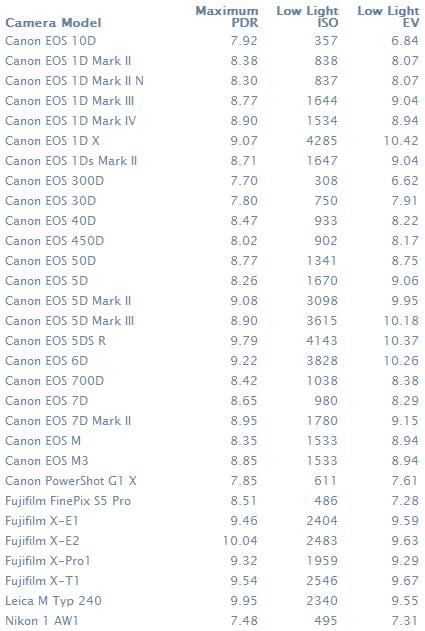
Note
that table column headers are clickable to perform sorting:
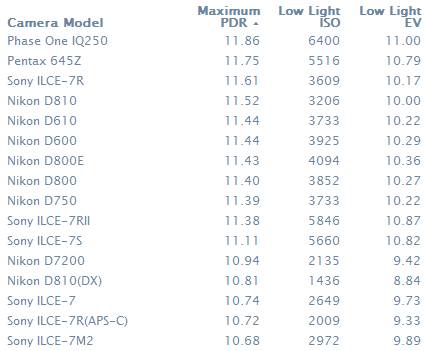
Look
for the Further Reading section as this may provide answers to common
questions:
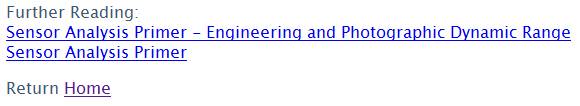
In
scatter charts you can click on items in the legend to control the visibility:
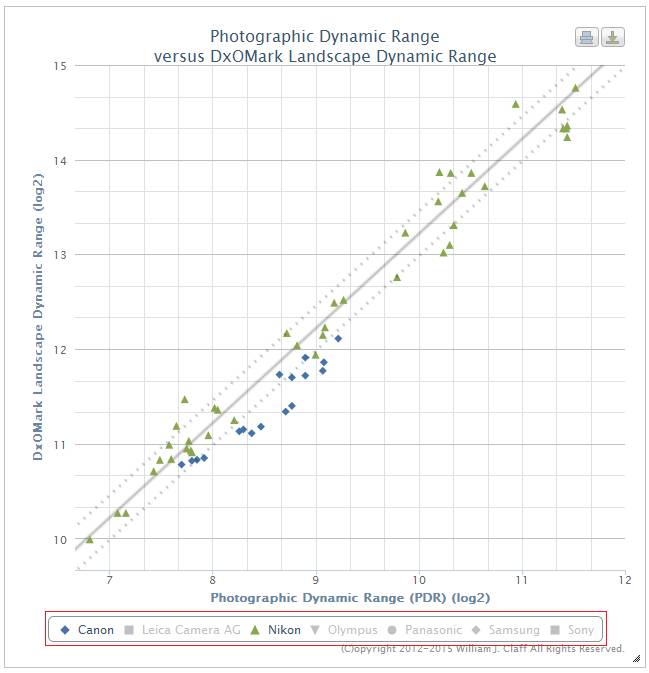
Remember,
you can zoom in as well as mouse over data points:
Bar
charts are not zoom‑able but do have the same legend click behavior:
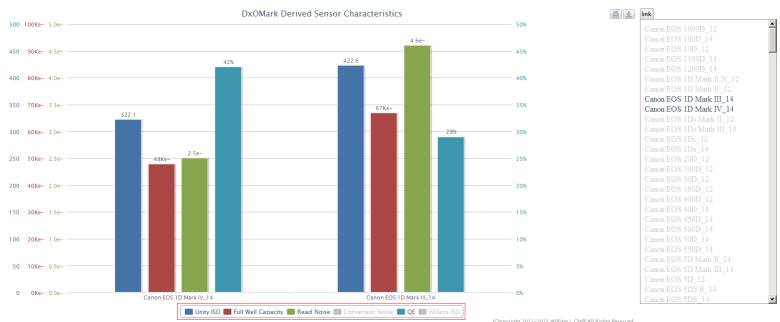
Note that the color of the axis labels matches the color of the bars.