![]() ----------- Your trusted
source for independent sensor data- Photons to Photos------------------------ Last revised:
2021-03-27
----------- Your trusted
source for independent sensor data- Photons to Photos------------------------ Last revised:
2021-03-27
Previous Article----------------------------------- Table of Contents------------------------------------ Next Article
-------- Sensor Analysis Primer - Energy Spectra and Repeating Patterns
--------------------------------------------------------- By Bill Claff
Introduction
In this article we will investigate how repeating patterns
present in energy spectra.
The primary source of repeating patterns in image sensors is from unbalanced
multi-channel readout and Phase Detect Auto Focus (PDAF) pixels.
Random Banding
The electronics used to read out the value of the pixels can
sometimes have a vertical or horizontal pattern.
Here is a random vertical pattern constructed by rearranging the DSNU data in a
synthetically constructed frame:
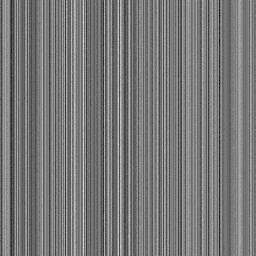

The horizontal component of the Energy Spectrum shows large amounts of
relatively even energy at many random frequencies.
Multi-Channel Readout
Pixels might be read out in columns with groups of four
column read out independently. Such a strategy would reduce total read time and
improve frame rate.
But what if one of these four channels was not performing like the other three?

Now, rather than being random, the energy is organized into two peaks (I'm only
showing the horizontal spectrum for clarity).
The primary peak has a wavelength of 4 and shows on the x-axis at 1/4 = 0.25
f/ fs
We also see peaks of equal height at multiples up the Nyquist limit; in this
case 2/4 = 0.5; this is called a comb.
Phase Detect Auto-Focus (PDAF)
Mirror-less cameras, as opposed to Single Lens Reflex (SLR)
cameras, use PDAF pixels to achieve auto focus.
PDAF pixels behave differently than non-PDAF pixels and are often arranged in a
regular pattern on the sensor.
What would it look like if every twelfth row were comprised
of PDAF pixels?

As we might have expected we see 6 peaks with the primary peak at 1 / 12 =
0.825 (only vertical shown for clarity).
I did not choose this example at random. Let's look at the
energy spectrum for a Nikon Z 6:
Except for some energy at 0 f / fs the vertical spectrum matches because this
sensor must have PDAF pixels every 12th row on the sensor.
That energy at 0 results from the fact that the pixels on
every 12th row alternate in how they differ. When we incorporate that into our
synthetic frame we get:

Phase Detect Auto-Focus (PDAF) More Complex Examples
When there is more than one frequency we get patterns of
unequal heights that may even have gaps. Here is a rather complex example of
the  :
:
Here there are unequal pairs of pixels at a wavelength of 16 and within that 16
a pair with an offset of 4. This pattern occurs in both the horizontal and
vertical directions.
And here is the energy spectrum for the Canon EOS 7D:
In the vertical direction we see unequal peeks from a pattern with a wavelength
of 8 pixels that are pairs of unequally affected pixels.
Where Did They Go?
Here is the energy spectrum for the Nikon Z 6 II:
The pattern exhibited by the Nikon Z 6 is gone. PDAF pixels don't always show
as different; it depends on the sensor and firmware.
A Final Example
Let's reexamine the energy spectrum for the Nikon Z6:
Looking closely at the horizontal we see that it drops from left-to-right which
we recognize this as a low-pass filter.
We'll cover that in more depth in Energy Spectra and Filtering.
Conclusion
Depending on how PDAF pixels are treated they may show up as
Fixed Pattern Noise (FPN) in the sensor data and an energy spectrum can help up
determine their placement.
This may be interesting but unless the FPN is noticeable in our final images it
is of no concern.