Autofocus
System Design
by Marianne Oelund
Autofocus System Design
This thread will present the stepwise
development of a phase-detect autofocus system, using basic optical concepts
and ray diagrams. The intent is to lay a solid foundation for the reader, to
understand concepts critical to autofocus optics and operation, at a level
which is visual, intuitive and readily understandable. There will be some
mention of mathematical concepts that apply, but a working knowledge of them is
not required in order to follow the discussion and diagrams.
See the following posts for presentations of
each step in the development. More posts will be added later, as I have time,
and/or in response to questions. The initial posts cover the fundamental optics
for the AF system, starting with a single lens, then adding more optics to
complete the AF system optical model.
There are many misconceptions associated
with AF system behavior, as it is not always intuitive. Some readers may have
difficulty accepting the system characteristics described, and ask for
supporting references. The best reference I can give, is an optical system that
I have sitting on my table right now, configured as detailed in the first few
posts: It functions exactly as specified in this thread. I will post some
details of that system, and photos of its operation, at a later time (taking
photos can be easier than constructing theoretical diagrams, anyhow).
Suffice it to say that this thread will
present more than purely theoretical concepts. It is my hope that this will be
both fun and educational.
Step 1: The Phase Plane
All optical systems need to start somewhere,
so let's begin with a single lens. In addition to the usual considerations,
though, I'd like to discuss another aspect that is important in autofocus
optics: What I refer to as the "phase plane," also known as the
aperture plane.
Here we have the familiar double-convex
lens, its object plane, and image plane where focus is achieved:
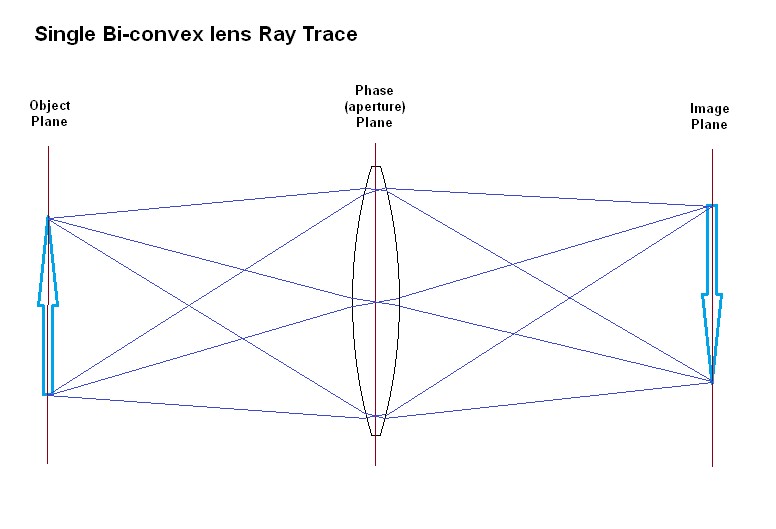
The object planes and image planes are
completely interchangeable. You may place a subject at either one, and an image
will be formed at the other. Hereafter, I will often refer to these planes
simply as "image planes" regardless of whether an object, or an image,
is placed there. The lens works by providing a straight one-to-one
correspondence between points on its two image planes, and does so in a
well-behaved, linear fashion with (ideally) no scale variation.
Now let's think a bit about the light rays
at the plane of the lens itself. The first fundamental concept is that you can
take any small area on the lens, and the light rays passing through just that
tiny area can form a complete image. (Anyone who has worked with holograms will
be very familiar with this concept. Holograms use wave phase information -
interference patterns - to encode an entire image at every elemental area on
the film.)
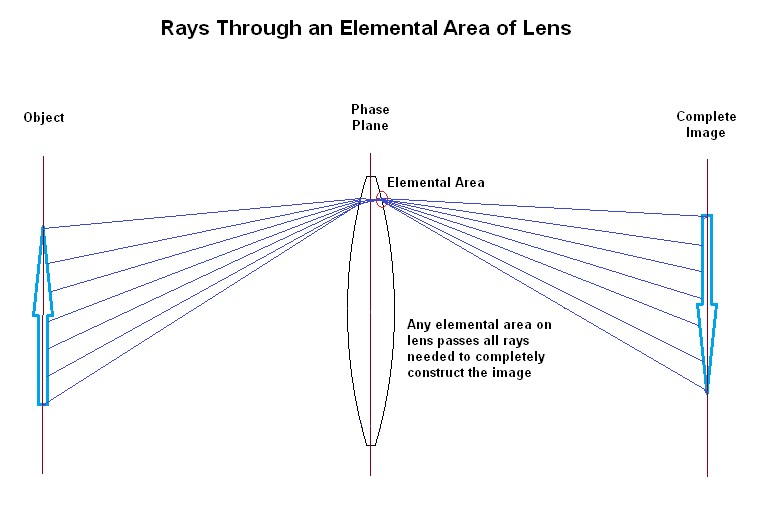
All of the rays
required to form a complete image, are passing through the small area on the
lens plane. How is the image information represented? Each point on the image
(or subject) has a unique ray angle associated with it, that is, the ray angles
"encode" the image. In many applications, angles constitute "phase"
thus my term for this plane is "phase plane." A mathematical
operation known as the two-dimensional Fourier Transform can convert
phase-plane information to image-plane information, and vice versa.
The only
difference between the image projected by the entire lens, and the image
projected by any small area of the lens, is the image brightness. In both
cases, the image will still be complete, even if we chose a small area that is
off-center.
Now, if we
consider all of the small areas on the lens plane together, we see that there
is a large collection of rays, constituting a somewhat complex light field.
Think about this: What if we had a way to precisely duplicate such a light
field artificially? If we placed a lens at that light field, it would be able
to project an image from it.
When you're
comfortable with that idea, go on to Step 2.
Step 2: And Then There Were Three
Now we get to do something apparently
destructive: Take a thin diamond saw, and cut the lens into two sections, along
its central plane, and polish the surfaces nicely. That makes two plano-convex
lenses with the same diameters as the original lens.
Line the two
lenses up on the same axis, with a wide space between them. To restore our
optical system to its former operation, what could we do? Think about that
phase plane again: If we could transfer the phase plane produced by the left
lens, to the surface of the right lens, then it could project the same image
that it did before, when the two lenses were still one.
If that sounds too
difficult, rest assured that it's not. In fact, it's a perfect job for another
convex lens, and we then end up with a system of 3 lenses. As it turns out, a
lens is not only capable of projecting an object to an image, but it's also
perfectly suitable for projecting one phase plane, to another phase plane.
Let's inspect a few of the rays to see how this works.
Choose a lens with
a focal length that is 1/4th of the distance between the two plano-convex
lenses that we made with the diamond saw, i.e., the distance between the plano-convex
lenses is 4f, where f is the focal length of the third lens we add, placed
exactly between the other two lenses. Call this third lens the "field
lens" since its job is to transfer the light field from the left lens, to
the right lens:
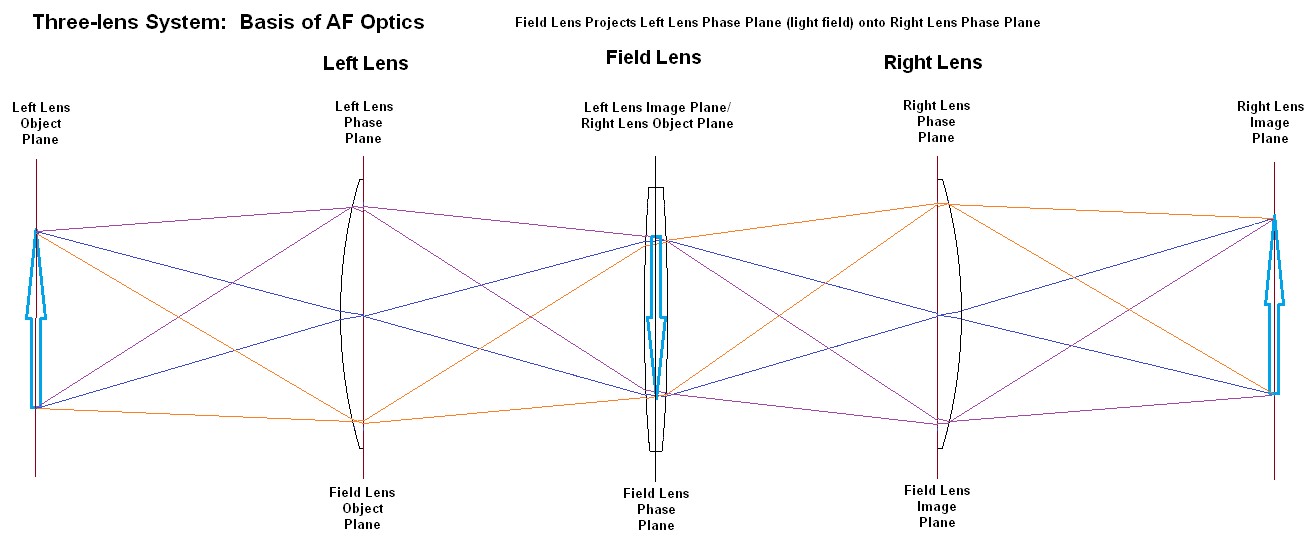
By inspection and
symmetry, we see it's possible to select any point on the left lens, and a pair
of rays coming from that point, through the field lens equidistant from the
optical axis, which arrive at a corresponding point on the right lens (same
point, vertically inverted). Additionally, the angles of the rays have been
precisely duplicated, since the rays form a parallelogram around the field
lens. Since we now have rays arriving at the right lens, at the same (vertically
inverted) point, and at the same angles that they had leaving the left lens,
the light field has been duplicated. The right lens must be projecting the same
image that it did before - except that it's inverted. (The inversion won't
cause a problem for our AF system, as long as we allow for it.)
Our system of 3
lenses has five planes which are significant to us, but which have slightly
different meanings to the three lenses:
1. At the far
left, the left lens object plane.
2. At left lens center, its phase plane - which is also the field lens object
plane.
3. At field lens center, its phase plane.
4. At right lens center, its phase plane - which is also the field lens image
plane.
5. At the far right, the right lens image plane.
There is a
relationship between the field lens focal length, and the left/right lens focal
lengths: For an AF system, we want the field lens phase plane to coincide with
the left lens image plane, in other words the left lens is projecting its image
onto the field lens. We also have the right lens object plane coinciding with
the field lens phase plane. (Note the horizontal scale of this diagram is
compressed relative to the original single-lens diagram.)
I should probably
comment that with the three lenses spaced this way (left-lens image plane
coincides with right-lens object plane), we could remove the field lens and the
two remaining lenses would form the same image. However, the field lens still
serves an important purpose, as we will see in the next step.
Note: If you are
familiar with relay lens systems, you will notice some similarity. Relay
systems differ in that they align image and object planes only, thus are much
greater in length (it is their purpose to lengthen optical systems).
The next step will show the advantages we can
obtain from the image/phase plane coincidences.
Step 3: Virtual Apertures
Here is where the field lens becomes
especially important. Recall that its image planes are at the left/right lens
phase planes. This means that it will project any object at one of those
planes, onto the other. For example, if we take a Sharpie pen and write a
letter on the left lens surface, then shine some light through it, the field
lens will project that letter onto the right lens surface.
This will also
work for an aperture. Let's add an aperture diaphragm to the left lens. The
field lens then projects that diaphragm onto the right lens. In other words, a
covering on any part of the left lens that will not pass light, will deny light
reaching the corresponding part of the right lens. We say that the right lens
has acquired a virtual aperture, which is identical in size and shape to the
real aperture on the left lens.
This works in
reverse, as well. Placing an aperture on the right lens, produces a matching
virtual aperture on the left lens. Any light passing through the left lens, in
the covered virtual-aperture area, will hit the aperture diaphragm on the right
lens and thus will not reach the right lens. Conversely, light passing through
the open area of the virtual aperture on the left lens, will hit the open area
of the real aperture on the right lens, and thus pass through:
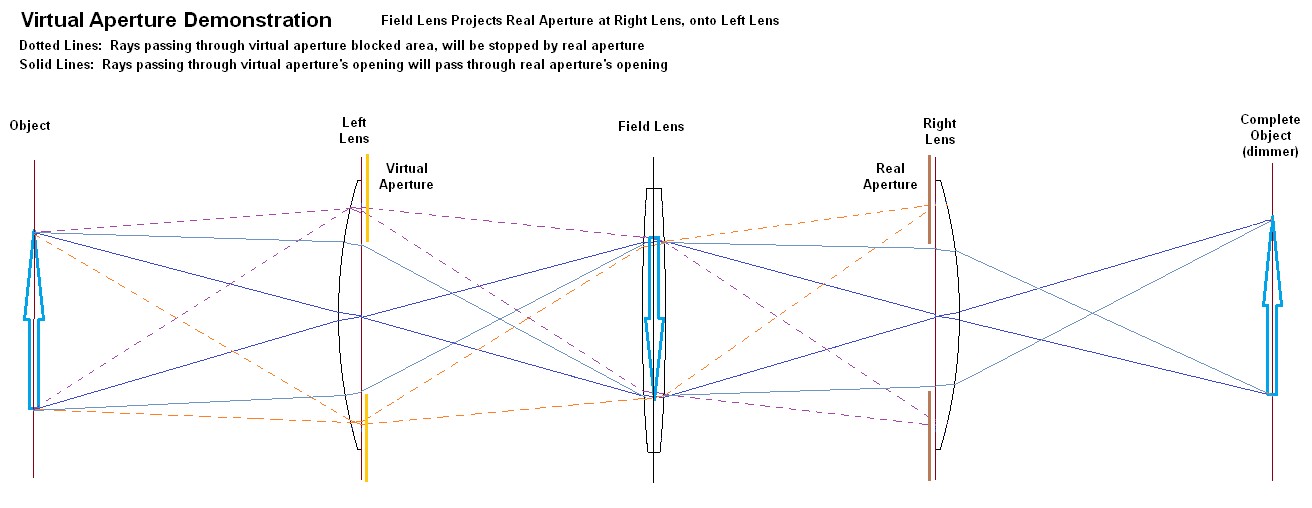
Since our system
presently has left and right lenses that are the same size (let's suppose
they're both 50mm diameter), the effect of a given aperture diaphragm on either
lens will be the same: Stopping it down will darken the final image at the far
right, projected by the right lens.
Now consider the
effect of having real aperture diaphragms on both the left and right lenses,
independently adjustable. If we stop the right lens down to only 10mm diameter,
for example, all of the light from the left lens outside of its central 10mm
will be rejected. In this situation, placing a real aperture on the left lens that
is larger than 10mm will have no effect, as it's just blocking light that was
already blocked at the right lens diaphragm. Thus we will see no effect from
the left-lens diaphragm until it is reduced to less than 10mm diameter. Any
larger diameters will not change the brightness of the image projected by the
right lens.
Making a Couple
Adjustments
In practical AF
systems, the right lens - known as a separator lens - is quite small. Let's
make our system more representative by changing the right lens to 6mm diameter.
This is the same as placing a 6mm-wide aperture diaphragm in front of the
former large lens, so the separator lens will only receive light from the
central 6mm of the left lens. Now the brightness of the image projected by the
6mm separator lens will be much less than from the previous 50mm lens - but it
will not be darkened further unless the diaphragm on the left lens is reduced
to less than 6mm. The small separator lens also has a much shorter focal
length, projecting a smaller image.
Another change we
need to make, is to offset the separator lens from the optical axis, and add a
second separator lens diametrically opposite to it. Let's offset these
separators 9mm from the optical axis; then their circles will span from 6-12mm
away from the optical axis. We also add a mask in front of the separators, to
eliminate flare problems from rays that do not enter the separators.
Each separator
will receive light from the left lens, across corresponding 6mm circles, also
offset 9mm from the optical axis (since our system currently has the field lens
centered). This means that setting any aperture diameter on the left lens that
is 24mm or more, will not block any of the light reaching the separators. If we
stop the left lens down to less than 24mm, the images projected by the
separators will start to darken, and when the left-lens aperture reaches 12mm
or less, the separators will receive no light at all.
In this diagram,
the images of the separator lenses on the left lens (shown in gray) are the
only areas that rays can pass through, and reach the separator lenses (rays
shown solid). Other rays (dotted lines), not passing through the separator lens
images, will miss the separator lenses at the right. The aperture diaphragm on
the left lens is shown at nearly the narrowest setting that will not block
light rays to the separators; if it is opened up more, it will admit more rays,
but they will miss the separators:
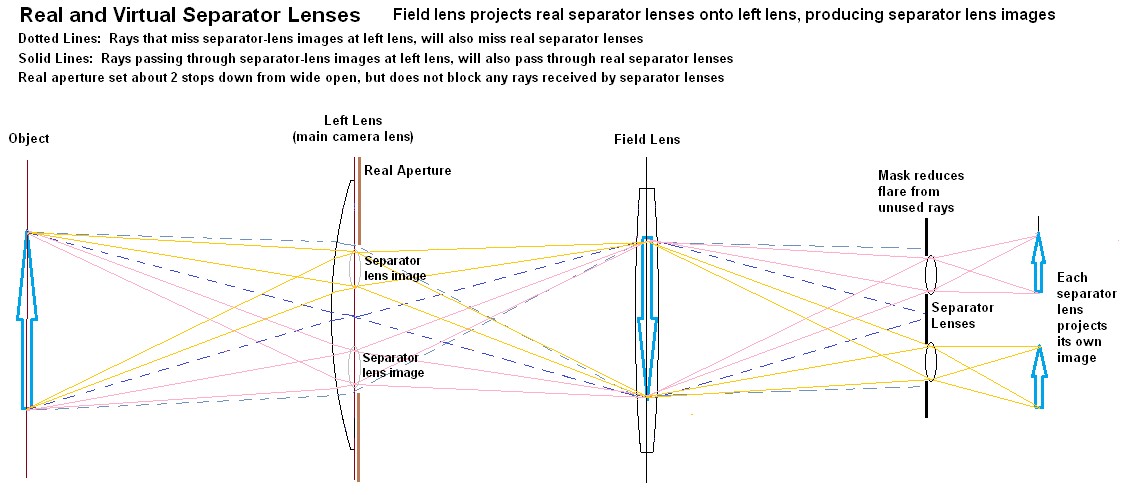
In Nikon's AF systems, the separator-lens images are set
just inside the f/5.6 circle. This diagram shows why lenses with maximum
apertures larger than f/5.6, are not able to send more light through the
separator lenses, to the AF detector, than an f/5.6 lens can.
Lessons from the Real Optics Model
As mentioned in the opening post, I have
been using a real model alongside the theoretical analyses, primarily as a
means of confirmation. It is also valuable as a demonstrator, and since I'm
rather tired of producing diagrams, I thought I'd use some photos instead.
Here is the real optics model:
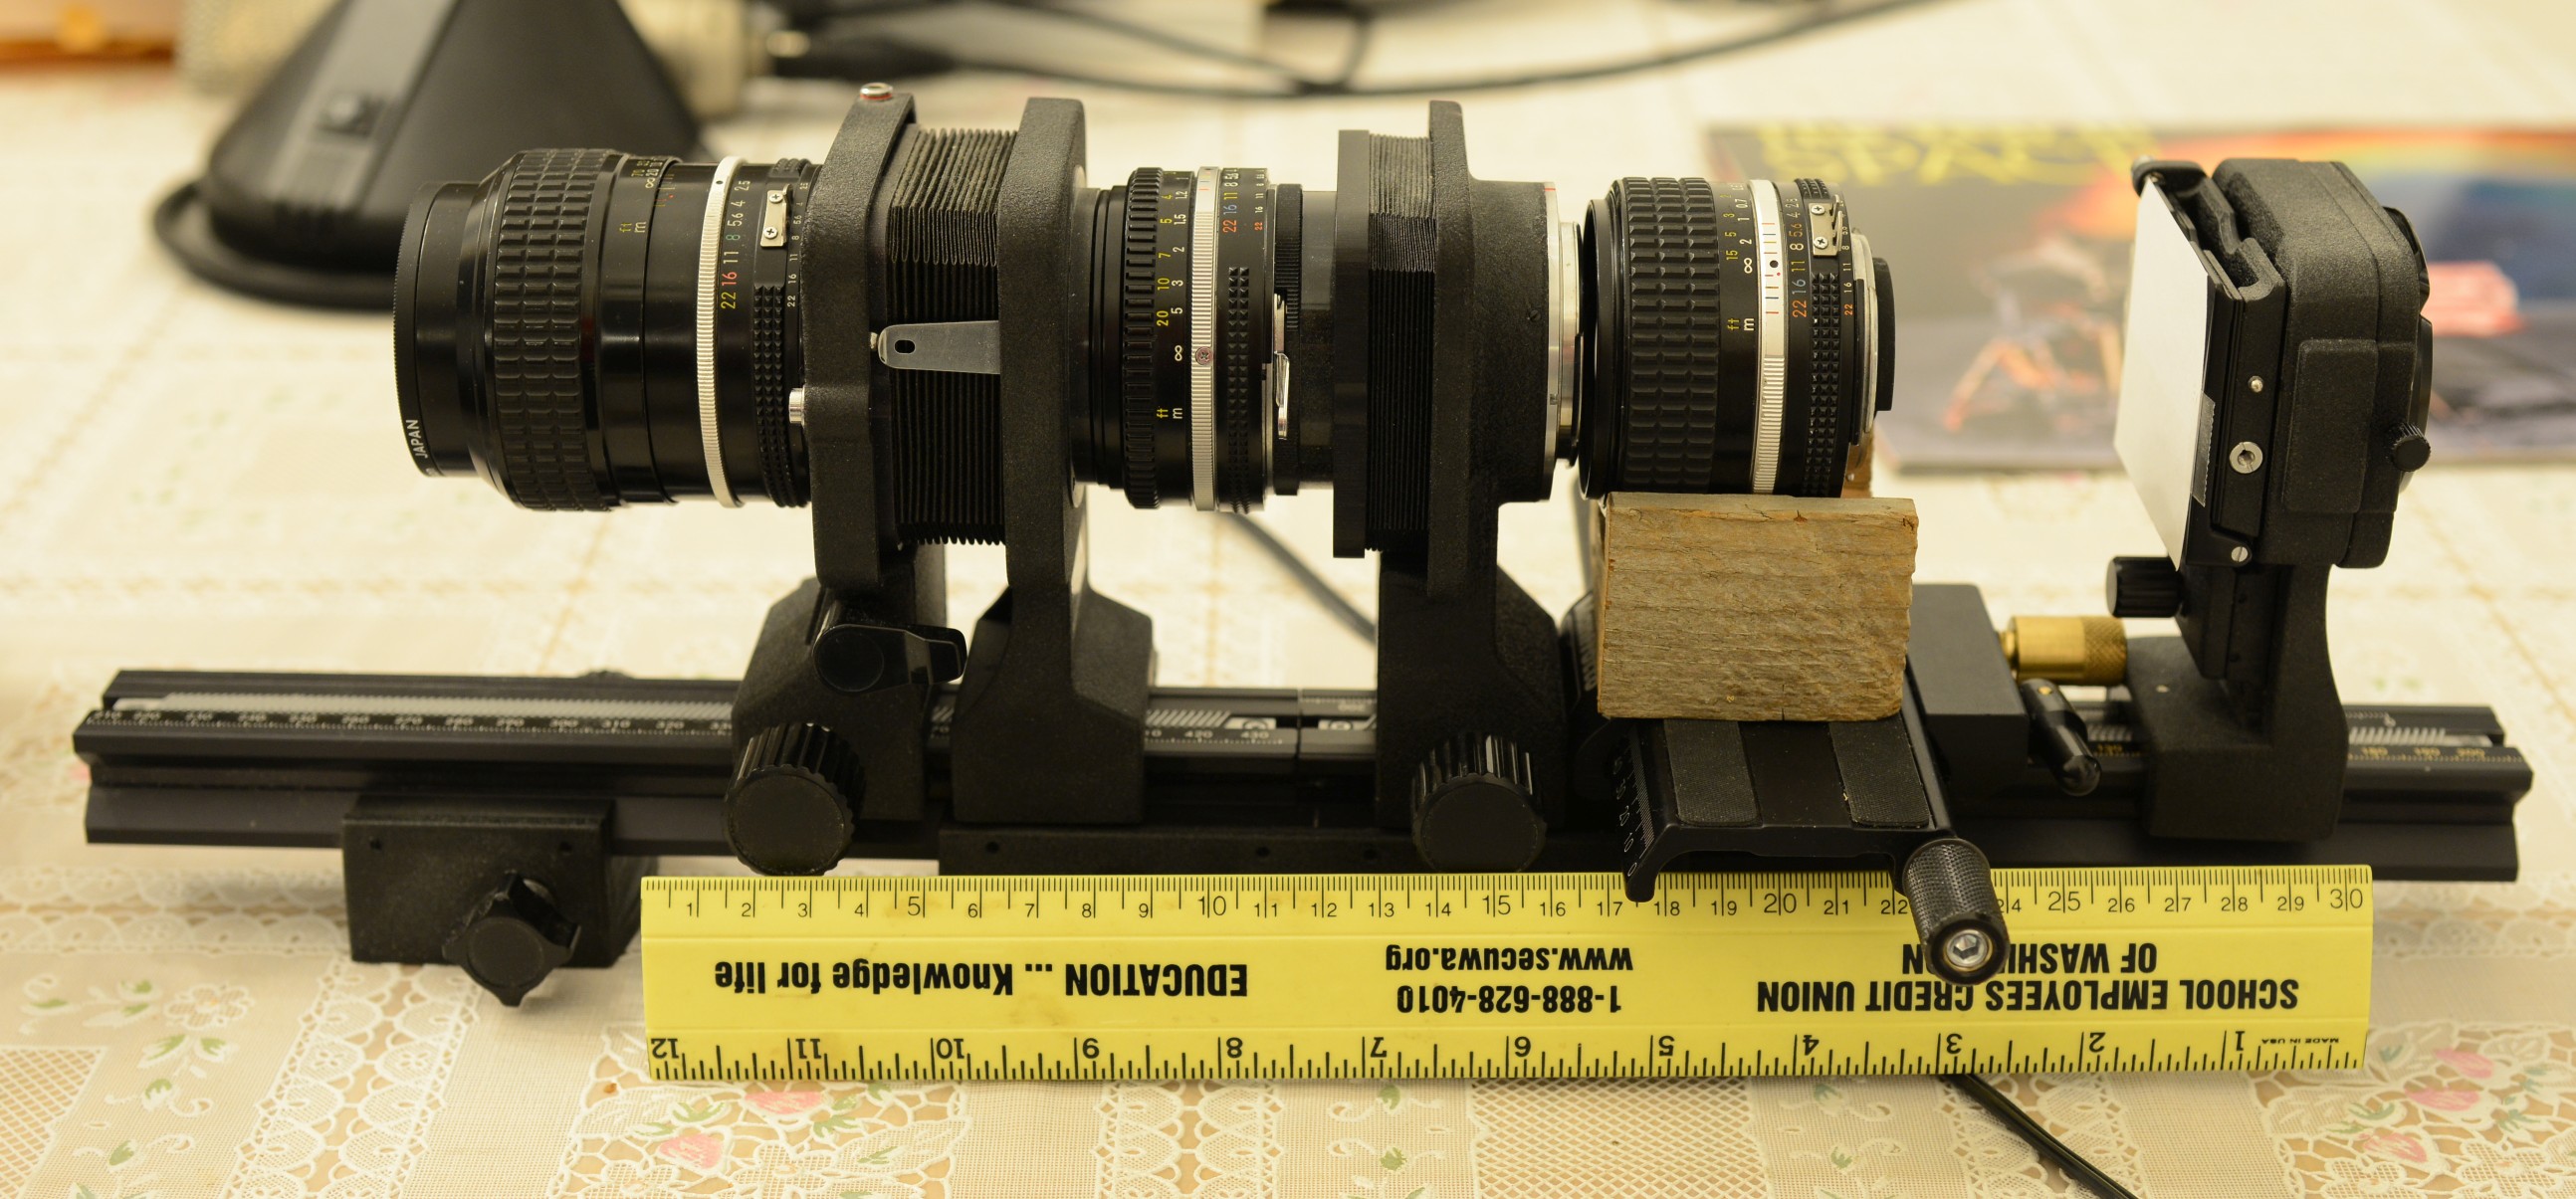
AF optics model: Three lenses plus projection screen
At the left is the
AIs 105mm f/2.5, serving as the main imaging lens (aka "left lens" in
the theoretical diagrams). The field lens in the middle is the AIs 50mm f/1.8,
and the separator lens is the AIs 28mm f/2.8. As described earlier, the spacing
between the main and separator lenses is 4f or 200mm (f is the field lens focal
length, 50mm). The separator lens rests on a wooden cradle attached to a
lateral micro-adjust slide, so I can set it to precise lateral displacements.
Virtual Apertures,
Revisited: Subject Masking
We again apply the
concept of virtual apertures, this time to the image planes of the left and
right lenses instead of the image planes of the field lens. An aperture
or mask at any one of these locations effectively "crops" the subject
down, which helps to keep the images projected by the separator lenses from
overlapping or producing flare.
Placing an aperture
mask at any one of those 3 planes will effectively mask the other two as well,
as discussed previously for the field lens object and image planes. It is
usually most convenient to place this mask in front of the field lens. In the
real model, we simply need to stop the field lens down. In practical AF systems
with regular arrays of AF points, a rectangular mask is often desirable.
It's important to
understand that adding this subject mask to the system does not darken the
images projected by the separators; it just eclipses (crops) those images so
that they cover a smaller area.
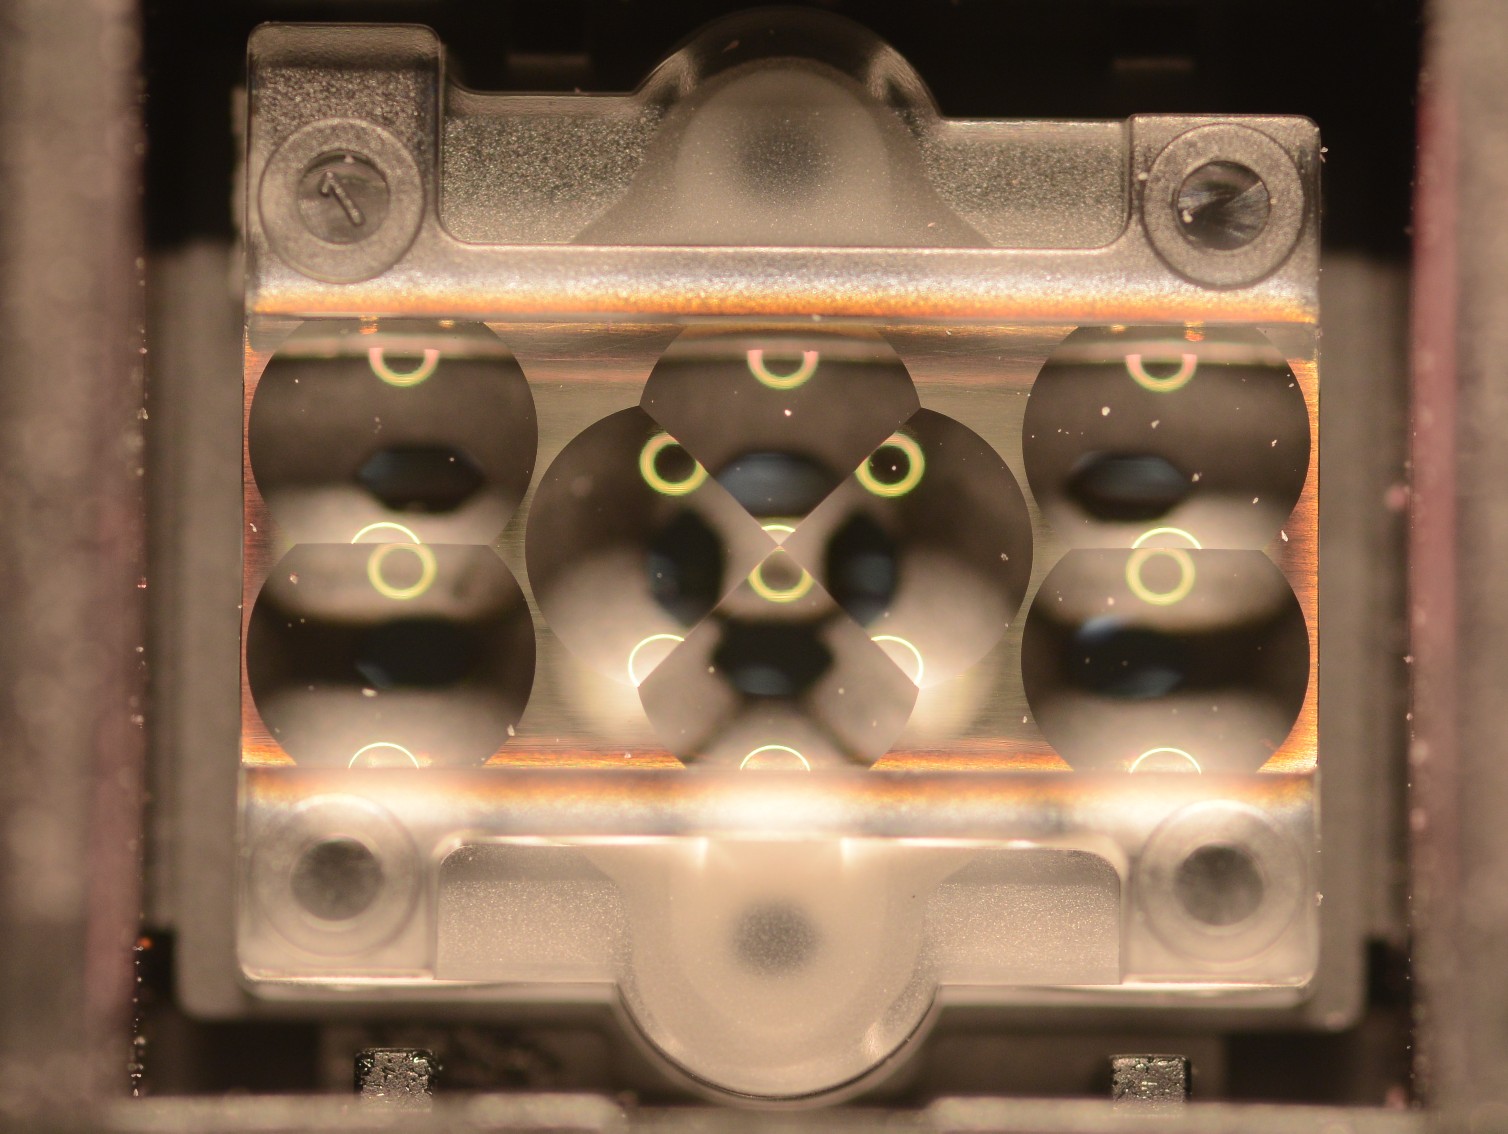
In this series of examples from the real
model, we see the reducing aperture of the field lens cropping the AF
detector's view of the subject (and you can clearly see the shape of the AIs
50mm's diaphragm opening). These are photos of the projection screen on
the model, which simulates the surface of the AF detector:
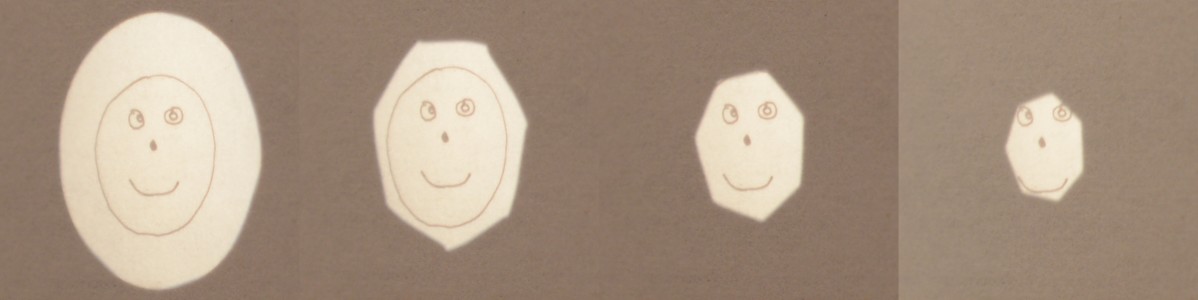
Cropping of detector image by field-lens aperture - sequence covers
f/1.8 to f/5.6 settings
Real Optics Model part 2
For this demonstration, the model has been
set up with the separator lens aperture diameter at 2.6mm (set f/11 on aperture
ring), and the lateral shift has been set to 5mm. This places the separator-lens
image just inside the f/5.6 circle at the main lens, as is standard in Nikon AF
systems.
By taking a series of photos of the image
projected on the screen (AF detector), as the main lens aperture is adjusted,
we see when light starts to be reduced for the AF detector. This sequence
starts at f/2.8:
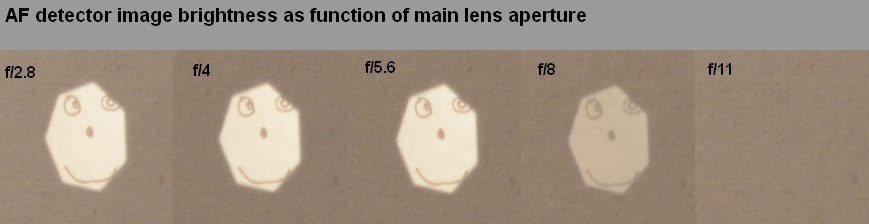
We see clearly, that there is no change in
detector-image brightness until the main lens is stopped down past f/5.6. At
f/8, it is noticeably dimmer, and at f/11 it is no longer visible at all since
the main lens aperture has completely covered the separator-lens circle in the
main lens exit pupil.
AF System Effective Aperture
Since the AF detectors are receiving light
through a fairly small circle on the main lens exit pupil, the effective
aperture of the AF system is quite narrow, producing a high value for the focal
ratio (f-stop). Although this makes the AF-detector image rather dim, it also
has the benefit of yielding a high DOF or depth of focus for the AF sensors,
which helps in determining focus errors when the main lens is far out of focus.
When a lens is focused at infinity, its
focal ratio is given by f/d, where f is the focal length and d is the physical
diameter of the lens entrance pupil. More generally, the focal ratio is
effectively the lens-to-image distance divided by the lens entrance pupil
diameter. Referring to the "Virtual Separator Lens" diagram posted
earlier, we see that the lens-to-image distance for the separator lens can be
taken as the distance from main lens to field lens, and its entrance pupil
diameter is the diameter of the separator lens image circle on the main lens.
For example, for the real optics model, the lens-to-image distance is 100mm and
the separator-lens diameter is 2.6mm, giving a focal ratio of 38 - very high!
For commercial AF modules, we find that
effective focal ratios run from about f/22 to f/32, for AF sensors that are set
to the f/5.6 circle of the main lens (AF sensors set up for f/4 or f/2.8 can
have "faster," or brighter, focal ratios).
Measuring Focus Error
We now turn to the ultimate goal of all of
this optics discussion: How the optics give us a measure of focus error.
Forcing the separator lenses to view the
subject from two different points on the main lens, which are offset from the
optical axis, gives them an angled view of the subject - just as human
binocular vision has. Because of the angled pathways, a change in the main lens
focus setting produces a shift in the position of the two AF-detector images,
towards or away from each other. For additional description of this, and
experiments you can perform yourself, see AF
Sensitivity and Function
As the main lens is focused closer, the two
AF-detector images move slightly closer together, or conversely as the main
lens is focused towards infinity, the AF-detector images move further
apart. The real optics model only has one separator lens due to its large
size, so we can only observe a single AF-detector image at a time.
The shift produced by changing main lens
focus is surprisingly small. Fortunately, it helps that the subject
masking (field lens aperture) gives us a reference position that does not move;
we can compare the image to its fixed boundary. One additional
complication with the model, is that there is also a noticeable change in
magnification as the lens focus is changed from infinity to closest-focus, so
it's best to look at the central point (nose) to see the movement. To
help make the change easier to see, I have set the separator lens lateral
position to use the main lens f/2.8 circle:
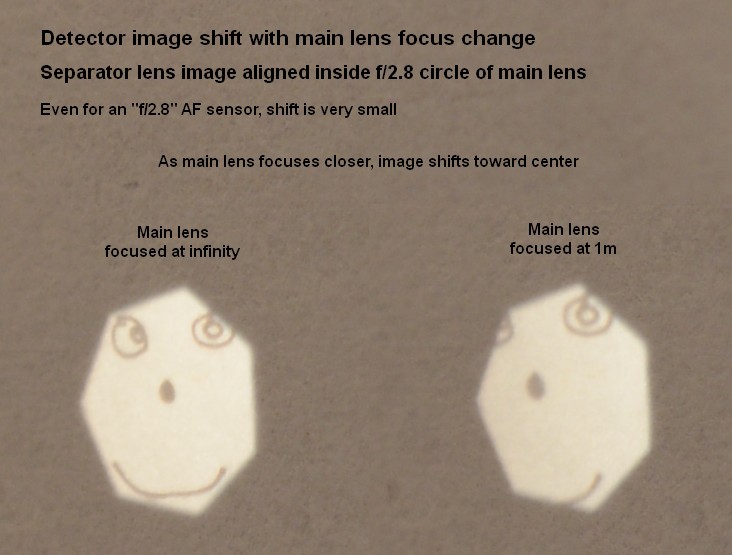
As the projected image in this example is
only around 4mm wide, we see that the image shift is even less than 1mm - not
much for a 105mm lens changing from infinity to 1m focus. One can imagine
how small the shifts are for f/5.6 AF sensors when wide-angle lenses are used.
As a final point, note that in spite of the
large focus change for the main lens, the AF-detector image does not go very
far out of focus. This is a good demonstration of the advantage of the
high focal ratio for the AF optics.
D3 AF Optics: Dimensions
It's time to take a look at an actual AF
system design. For the D3, we benefit from the sectioned-camera photo that has
been widely circulated, which allows estimating the dimensions for the AF
optics. From those, we can calculate a variety of parameters.
Our models have
had the field lens in a symmetrical case, but in an actual camera where space
for the AF module is very limited, the field lens must be used asymmetrically.
Dimensions we can
obtain from the D3 photo are:
Field lens
diameter: 10mm
Field lens to
separator lens distance: 22.3mm
Separator lens to
AF detector: 4.5mm
Field lens to main
lens exit pupil: About 80-105mm (typically) depending on lens in use.
AF detector chip
height: 6.5mm
We also know, from
the spacing between the top-row and bottom-row cross-type AF sensors as they
appear in the viewfinder, that the mask height for the field lens must be about
9mm.
We need to think a
little more carefully about the locations of the separator-lens images on the
main lens. These are aimed to fall inside the f/5.6 circle of
the main lens exit pupil, so that gives the outer boundary. The inner boundary
must be at f/8 or a little smaller. This means that the centers of
the separator-lens images need to fall on about the f/6.8 circle of the main
lens exit pupil. Thus it is the f/6.8 circle, rather than the f/5.6 circle,
which acts as the baseline for the AF system.
Now we can
calculate the following parameters for the central set of 15 cross-type AF
sensors, which use 4 separator lenses (top, bottom, left, right):
Height of image
projected by each separator lens onto AF sensor: 9mm * 4.5mm/22.3mm = 1.8mm
Separator lens
spacing (top-bottom or left-right), center-to-center: 22.3mm/6.8 = 3.3mm
Separator image
spacing (on AF sensor), center-to-center: 3.3mm * (4.5+22.3)/22.3 = 4mm
Overall height of
the set of 4 images projected by separator lenses onto the AF sensor: 4mm +
1.8mm = 5.8mm (fits nicely onto the 6.5mm-high chip).
Also, we find the
field lens focal length to be about 18mm and separator-lens focal length is
about 3.7mm.
Sobering
Numbers
From the above,
the figure that I want to consider next, is the height of the image projected
by each separator lens, onto the AF sensor, which is only 1.8mm. This comes
from an area of the main image which is 9mm high, in other words the AF sensor
is seeing an image only 1/5th the size of the image at the imaging sensor. It's
very small, and this has some consequences.
If we start with
an in-focus image and focus the main lens a bit closer, or the subject moves a
bit further away, the images on the AF sensor shift slightly closer together.
The amount of this shift follows the perimeter of the blur circle in the image.
Since the D3 has an 8.4um sensor pitch, we can just start to see the image
going out of focus if the blur circle diameter reaches about 20um, or if its
radius reaches about 10um. This 10um radius is how far each AF-sensor image
would shift - if the AF sensor had the same image size as the
imaging sensor.
Of course, it has
only 1/5th the image size, which means the AF sensor needs to be able to detect
an image shift of only 2um, in order to detect the image starting to go out of
focus.
It Gets Worse
That 2um shift
only corresponds to a main lens that has the same f-stop as we calculated above
for the AF system baseline: f/6.8. A very fast lens, such as an f/1.4 lens,
produces considerably more blur in the image for that 2um shift at the AF
sensor. If we want to keep an image from an f/1.4 lens from going out of focus,
the AF sensor will need to be able to detect an image shift of only 2um *
1.4/6.8 = 0.4um! That is only one-twentieth the size of the D3's image-sensor
pitch.
I trust this will
give you an appreciation for the precision required of the AF detector lines on
the AF sensor. As an exercise, you may repeat the above calculations for a
D800.
D300 AF Module in Operation
Today I received the D300 AF module that I
ordered last week, and immediately set to disassembling it. The most
important action was to remove the AF sensor from the top of the module,
so I could place a "screen" there which allows showing what the AF
sensor sees in actual operation. This was just a bit tricky, as the AF
sensor is glued to the plastic module housing with epoxy (see how hard I work
to show you guys this stuff)! I replaced the AF sensor with a bit of
frosty cellophane tape which can act as a diffuser, or as a screen.
I have some
interesting photos and measurements which I will share later. Right now,
we'll take a look at the field lens doing its projection
"magic." As you may recall from the early posts, the field lens
projects the main lens phase plane, onto the separator lens phase plane, or
vice versa. This also means that if an object is placed at one of those
phase planes, its image will form at the other. The main function of the
field lens, is to allow the separator-lens mask to be projected to specific
patches on the main lens, which we want the AF system restricted to using.
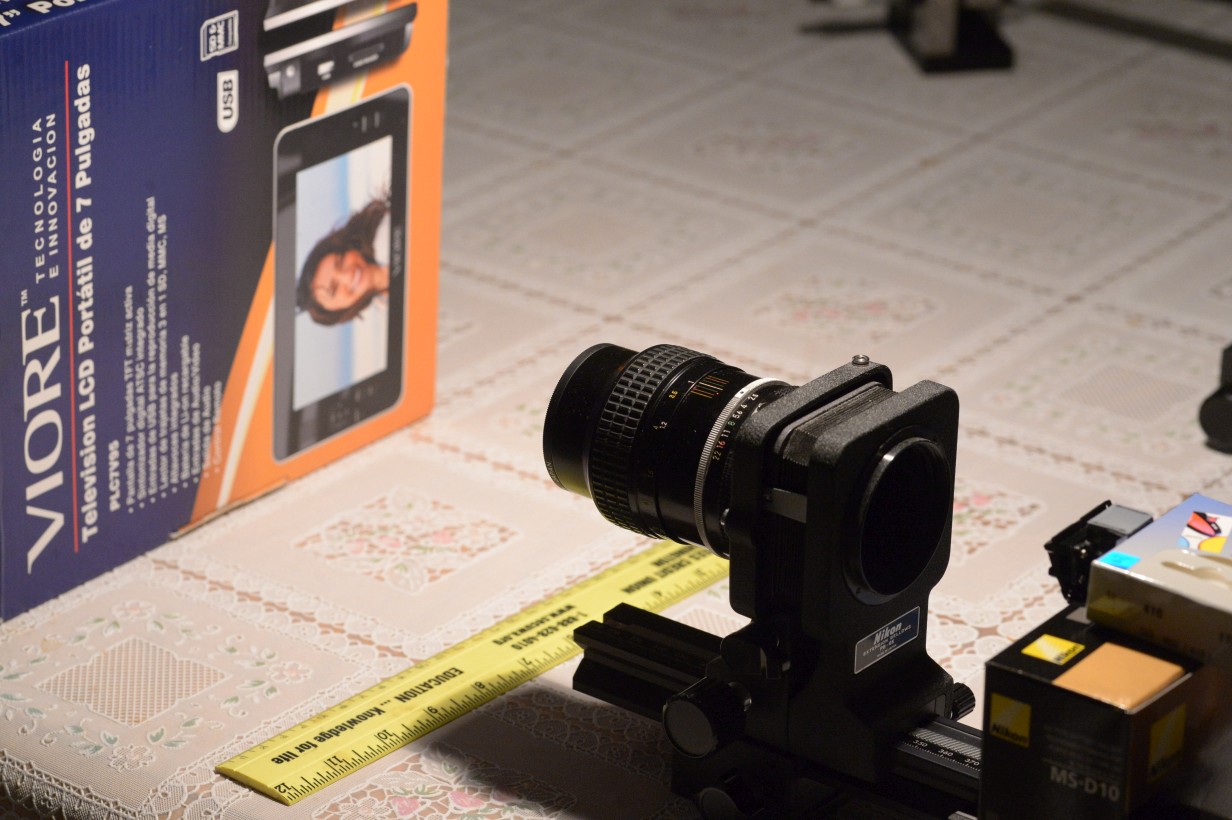
To demonstrate
this, I set the AF module up so it could project onto a screen (back of an
envelope, which I thought was suitable since we have a "back of
envelope" calculation to follow). Because there is no AF sub-mirror
in this setup, the module sits in a different position, than it does when
installed in the camera body.
I used a strong
lamp to shine light onto the frosty tape (on top of the module) that's
taking the place of the AF sensor; this light passes through the separator
lenses and their mask, bounces off a 45-deg. mirror, then goes through the
field lens, resulting in the separator-lens mask openings being projected onto
the screen.
Here is the setup:
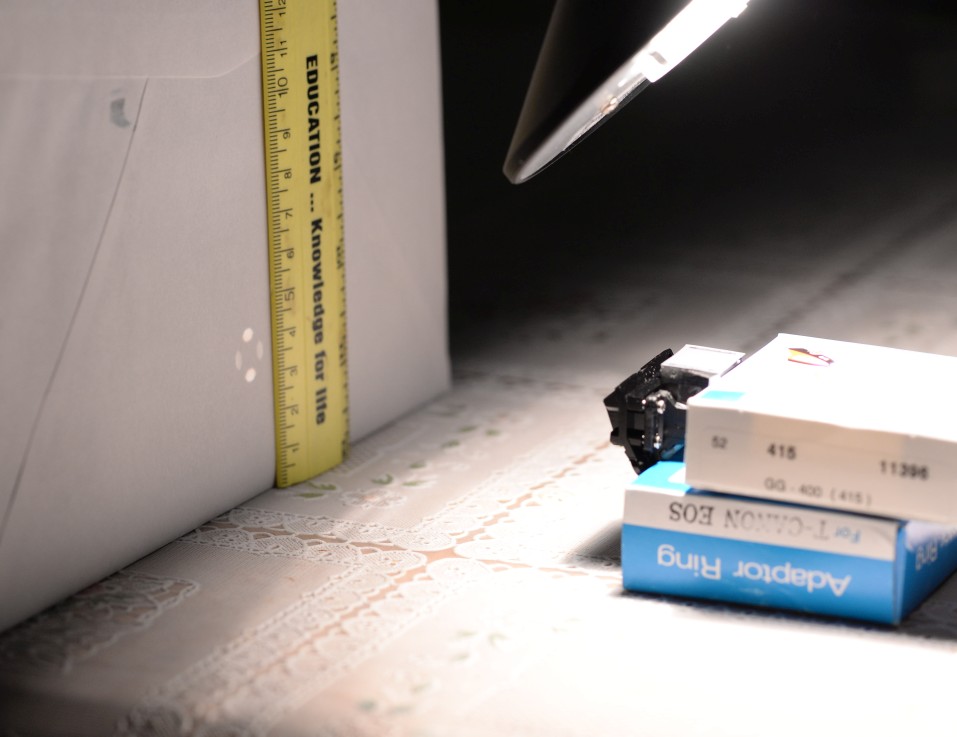
Separator-lens mask projected by field lens, onto screen
Here is a closeup of
the mask images:
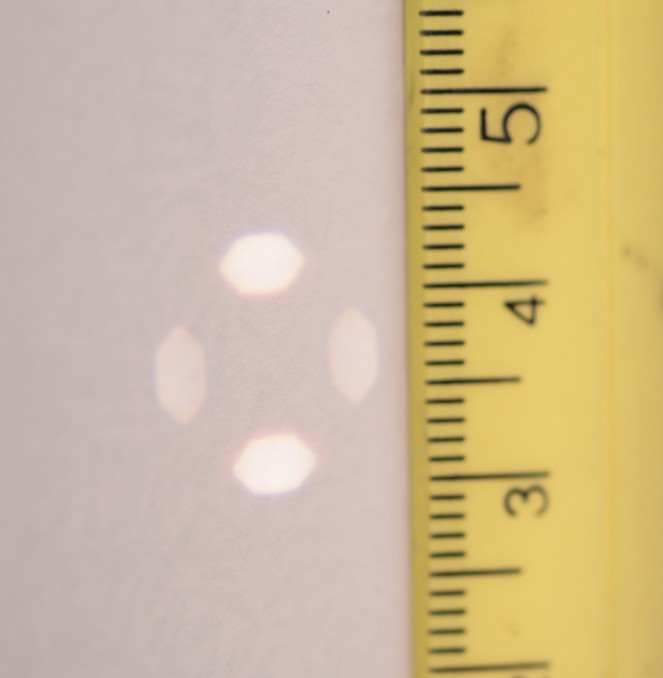
Mask images fit within a 13.5mm circle. Screen is 106mm in front
of field lens.
Note that only the
center group of AF points has four separator lenses since they're cross-type
points, while the outer groups of AF points only have two separator lenses (top
and bottom). Thus all three groups illuminate the upper and lower
patches, making them much brighter than the left and right patches. If
you look closely, you can see some CA at the edges of the patches because all
of these lenses are just molded plastic.
It's interesting
to see that Nikon have made the patches somewhat elliptical, to increase their
area and help with image brightness at the AF sensor.
Now for that
calculation: The field lens was set 106mm from the screen (that's where
it focused the separator mask best). The diameter of the circle
circumscribing all four patches on the screen, is about 13.5mm. That
means all of the patches actually fit inside the f/7.8 circle. In other
words - in spite of what the owner's manual may say - this AF system
is designed to be compatible with f/8 lenses. No wonder so many D300
owners have claimed that AF works fine when they add a TC-20 to their f/4
lenses! Sneaky Nikon. [In the case of the D3 AF system, I believe
they have actually used the f/5.6 circle.]
Now let's place
the AF module behind a lens with a well-lit subject, and send the light rays in
the normal direction:
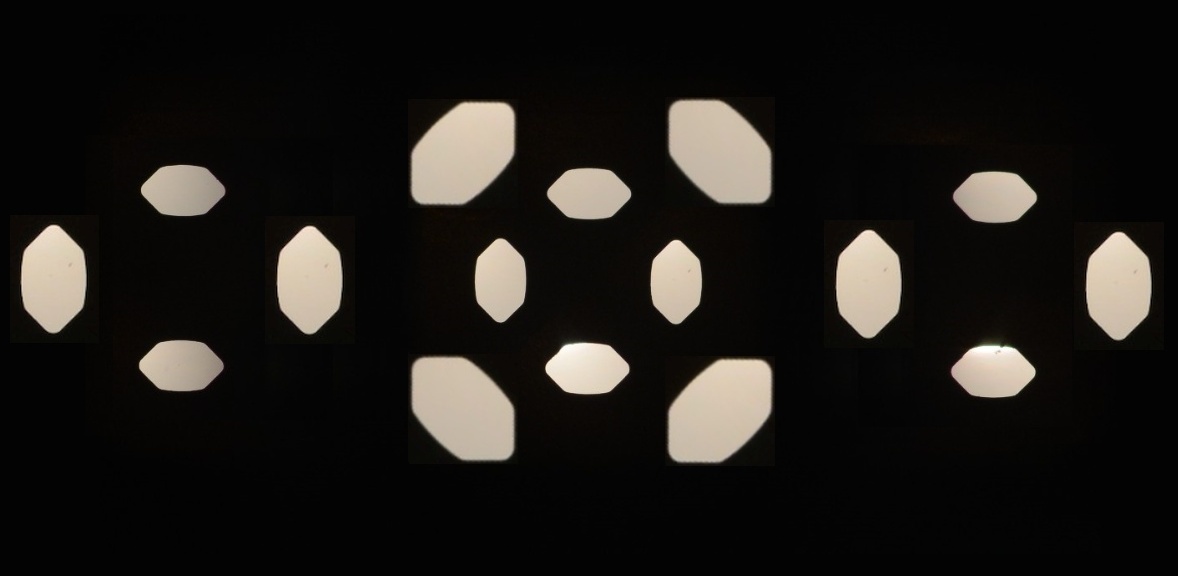
After moving the lamp so it wouldn't shine on
the AF module's cellophane-tape "screen," I could photograph the
images projected by the separator lenses. These are exactly what is
projected onto the AF sensor chip (if we ignore the extra texture added by the
plastic tape). The left and right groups of AF points each have two
separator lenses (top and bottom) and project two images; the center group has
four separator lenses, and projects four images. I took two photos, with
the lens focus set differently; see if you can tell the difference:
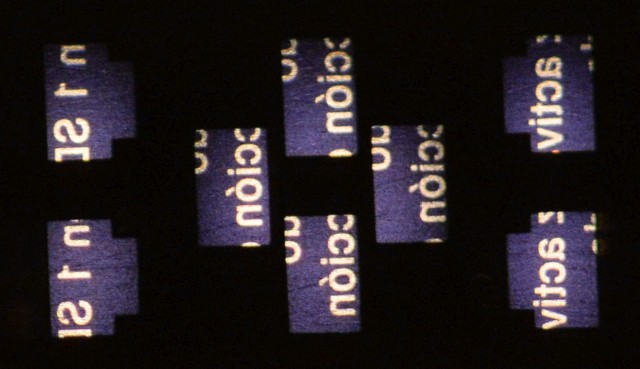
Images on AF sensor with lens back-focused
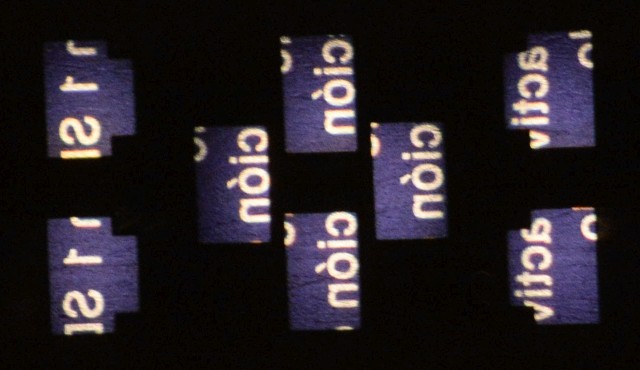
Images on AF sensor with lens front-focused
Perhaps the most
obvious difference, is the higher magnification when the main lens is focused
closer. However, if you look closely (compare top to bottom), you can see
that in the back-focused case, the images are a bit further apart than their
border frames. In the front-focused case, they are a little closer
together. If the lens were correctly focused, all of the images (for
each of the three groups) would be positioned within their frames exactly the
same.
The next post
will discuss details of the module design, and the AF sensor.
D300 AF Module Details
Here are my notes and photos from examining
a D300 AF module this week. Note: Some disassembly required.
Field Lenses
As is typical of
many contemporary AF modules, the AF-point array is divided into three
sections. The center section contains the 15 cross-type points, and each
lateral section has 18 points of unidirectional type. Each section requires its
own field lens with mask, and accompanying separator lenses.
The three field
lenses are molded as a single piece of clear plastic, and the mask has a single
large opening for each field lens. The center mask is 8.4mm high by 5.1mm wide.
Lateral masks are the same height, but 4.6mm wide, plus an outside
"extension" of 1.8mm for the furthest-outside 3 points.
Here are the field
lenses, after I reassembled the module. Please pardon the dust, and the slight
distortion of the mask (I don't think Nikon would hire me to assemble their
modules):
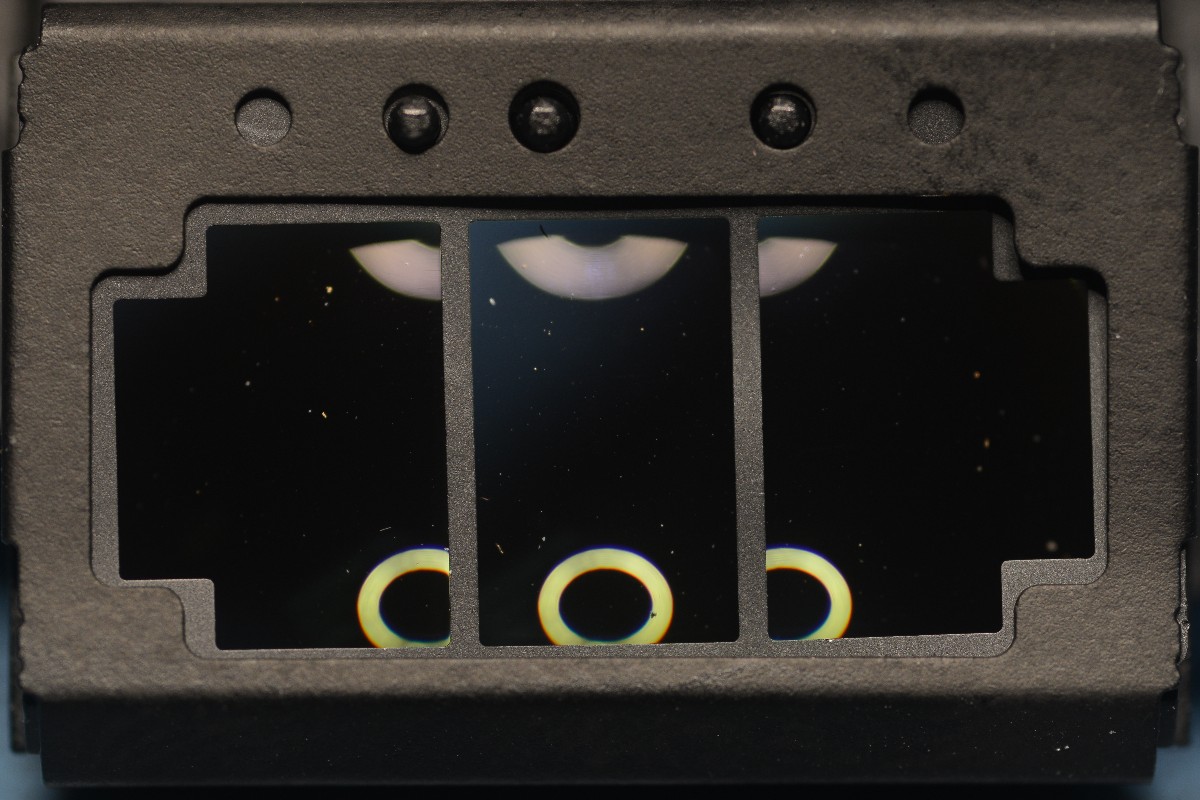
Three field lenses behind their masks. Reflections from overhead ring
light.
The field lenses are readily removed, allowing one to look directly into the
module and see the separator-lens mask via the mirror. It is best, however, to
remove the AF sensor chip from the module, to allow light to pass through the
separator lenses and illuminate the mask outline.
Separator Mask
With the AF sensor removed, and shining some light onto the
back of the separator lens cluster, we can image the separator mask:
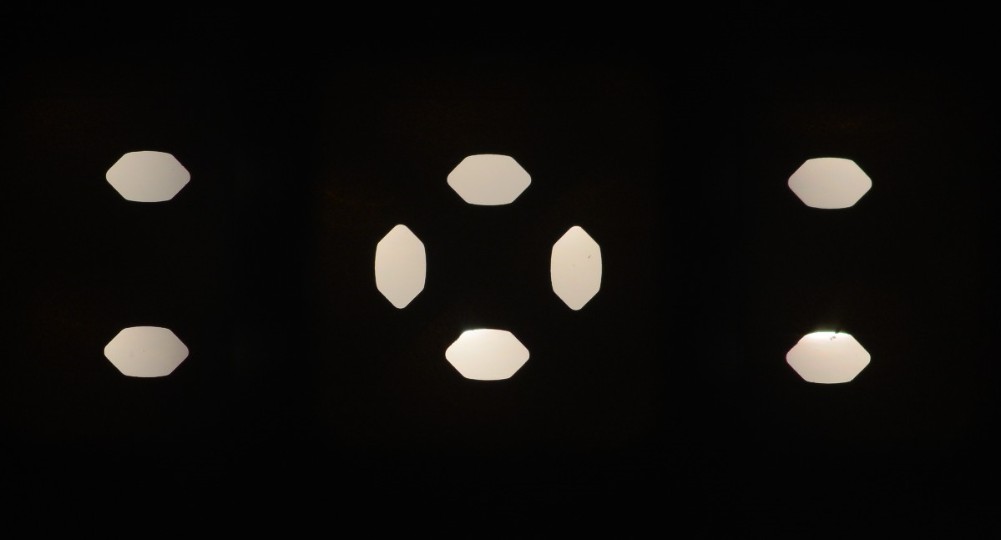
Openings in separator-lens mask
This mask is
located 21mm behind the field lens, along the optical axis. The center group of
four openings are for the cross-type AF points, which require four separator
lenses. The outer pairs are for the lateral AF points, which only need two
separator lenses each since they are uni-directional.
This mask directly
determines the size, shape and locations of the "patches" on the main
lens rear exit pupil, through which the AF sensor receives all of its light.
The outer field lenses are partially prismatic, and aimed so that their mask
openings are projected to the same place as the top and bottom mask openings of
the center group.
Each mask opening
is 1mm wide, point-to-point, and 0.60mm high. The oblong or "squished
hexagonal" shape gives a little more area than a circular mask would, for
a brighter image at the AF sensor. The center-to-center separation between each
of the four pairs is 2.07mm. When these are projected by the field lens to the
best-focus position of 106mm away, the net magnification is 5x and the area of
the projected mask image at the main lens is about 12mm^2.
The separation
between the pairs of mask openings is less than I had expected, and actually
gives this AF module the capability of focusing with f/8 lenses. The D3 may
have a wider separation, so that the images of the mask openings will take up
the f/5.6 circle at the main lens exit pupil.
Separator lenses
I did not remove
the separator lenses or their mask from the AF module, but did take a photo of
the separator lens cluster from the back side, which faces the AF sensor. Like
the field lenses, the separator lenses are all molded as a single piece of
clear plastic. Looking through the lenses, you can see the mask openings (out
of focus). It appears that there would be room for a different mask to be used
here, which has the openings spaced a little wider; that could potentially be
the only difference between this module, and the D3 version.
Separator lens cluster, molded as a single piece. Mask openings are
visible through the lenses.
The eight separator
lenses project non-overlapping images onto the AF sensor. The size and shape of
those images is set by the field-lens masks, and is scaled by the ratio of the
separator-lens and field-lens focal lengths.
In this D300 AF
module, the images projected onto the AF sensor are 1.88mm high by 1.16mm wide,
for the central group of cross-type points. The images for the lateral groups
are the same height, but have their unique shape.
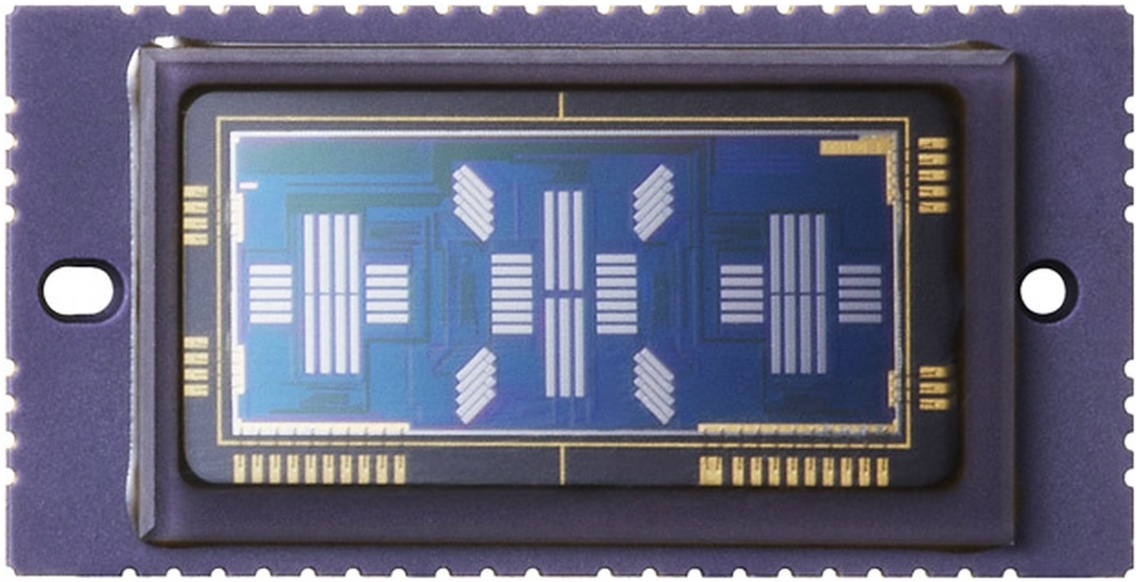
AF Sensor
The sensor's
ceramic package includes a "shoulder" at each side, coplanar with the
surface of the sensor die. These shoulders are seated against two projecting
ridges on the AF housing, and fixed with epoxy. It is the AF housing alone,
which sets the axial alignment of all of the optical components; there is no
adjustment provided. The lateral and vertical alignment of the AF sensor must
be done with the aid of a jig while the epoxy sets.
As is typical for
AF systems which have a large, regular array of AF points, the AF detection
lines are contiguous, rather than separate for each AF point. Here we see 22
"merged" vertical detection lines, and the 10 horizontal lines which
are used only for the center group of cross-type points:
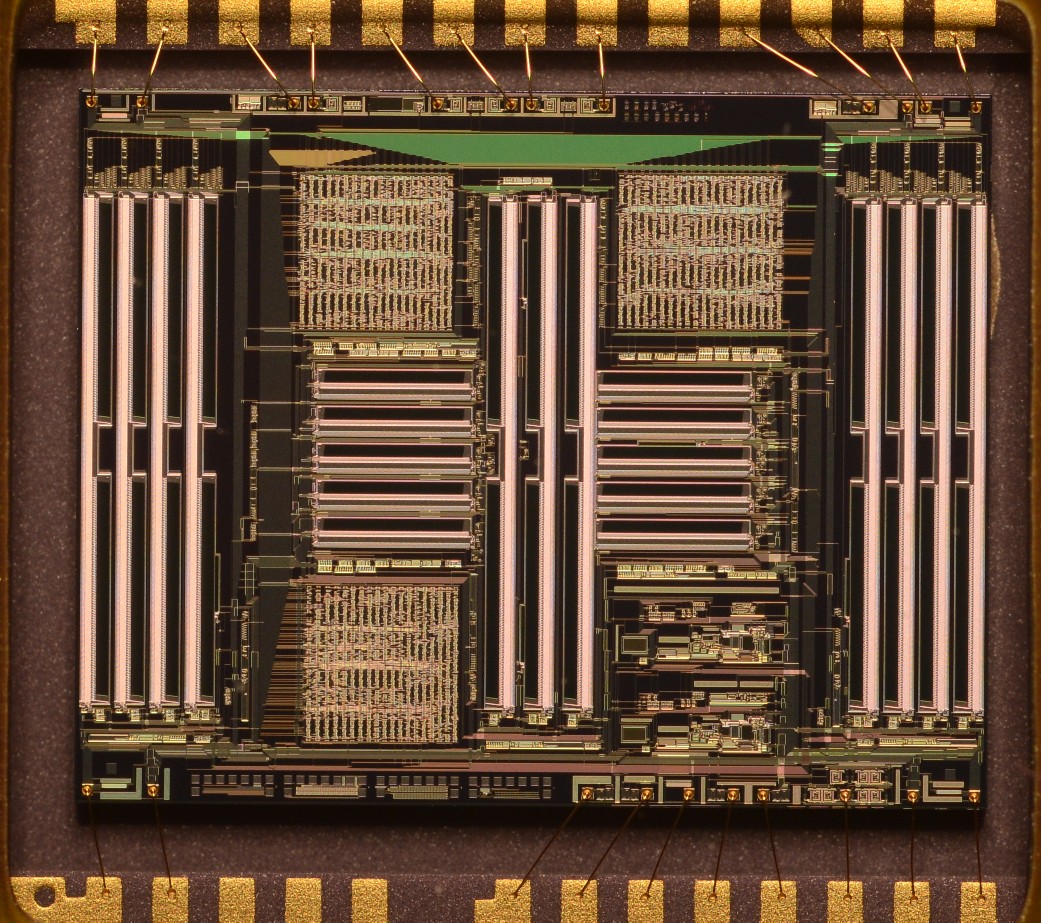
D300 AF sensor "chip" seen through its optical window.
The actual
detection lines are the narrow black rectangles; the white bars alongside them
are metallization for associated circuitry. In fact, the surface of the AF
detection lines is the optically darkest surface on the entire chip.
The sensor die measures
8.85mm wide by 6.92mm high. Each of the vertical detection lines is 2.08mm long
by 0.12mm wide; the horizontal lines are 1.36mm long. Comparing these to the
size of the images given above, we see that there is an extra 0.1mm of
detector-line length at each end, to provide some alignment margin.
The partitioning
of the long detector lines into individual areas for each AF point is done in
firmware, with the origin locations stored in flash memory. This requires a
calibration procedure at the factory, to determine the precise origins. These
are important, not only for correct location of the AF points in the image, but
also for focus accuracy. A number of D800 owners have learned what can happen,
if this calibration is not performed correctly.
The next post will
discuss the AF sensor in greater depth.
D300 AF Sensor
By superimposing a photo of the images
projected by the separator lenses onto the AF sensor, with an photo of the
AF sensor itself, we can see how the 8 separator images line up with the AF detection
lines.
In this view,
imagine that the sensor has become transparent, except for the detection lines
which show in white, and that you are looking through the AF sensor from the
back side:
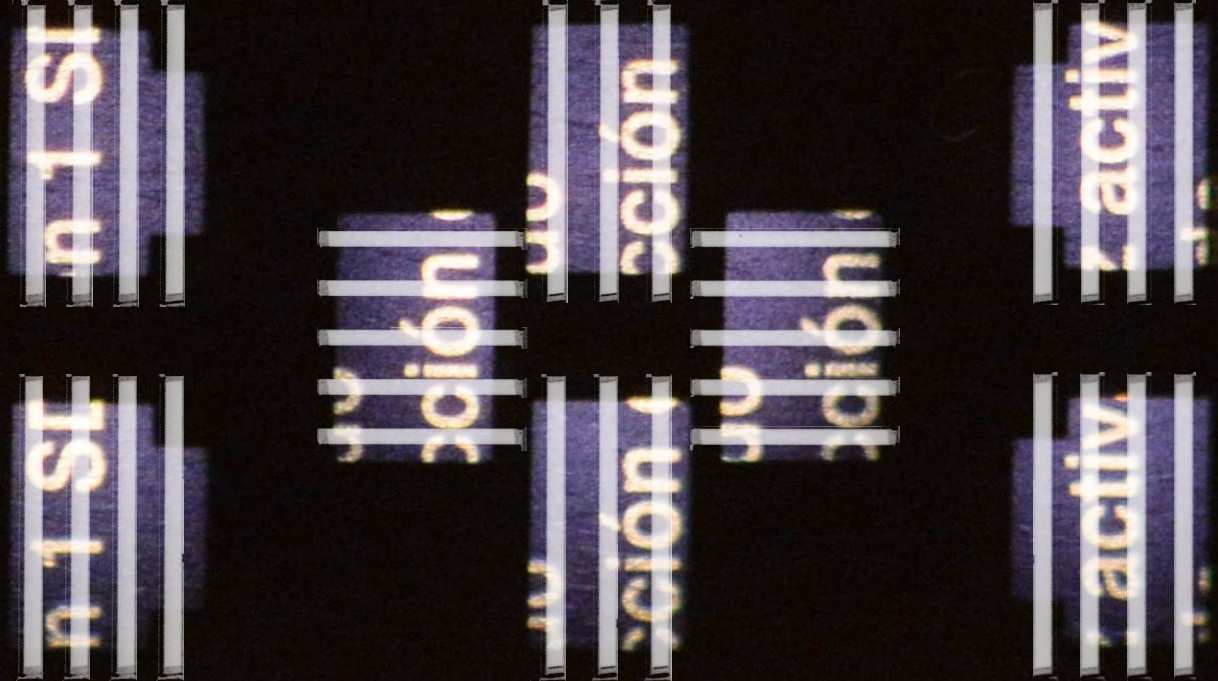
Alignment of separator-lens images with AF detection lines.
We see three
different images since each field lens and mask selects a different portion of
the camera's image - for left group, center group and right group. Note that
the left and right groups end up swapped to opposite sides of the sensor, thus
the outermost 3 AF points from those groups fall on the innermost of their
eight detection lines.
If the camera lens
were correctly focused, the two images in each of the four pairs (three
top/bottom pairs plus one left/right pair for center group) would be located in
exactly the same place on their detection lines. Here, the lens is back-focused
which causes each image pair to be spaced further apart; the AF system will
respond by focusing the lens closer until the image pairs fall in the same
place on their detection lines.
Detection Line
Detail
The sensel
structure in the detection lines is not visible, at least in the visual range
of wavelengths. No matter how much I push exposure and enhance contrast in the
sensor photos, I am unable to identify any periodic structures within the
detection lines. However, we have some useful clues from the adjacent
circuitry. Alongside each detector line, is a sequence of circuits which repeat
at 6um intervals; this may correspond to the sensel pitch along the length of
the line. This means that each vertical line would have 350 rows of sensels,
and each horizontal line would have about 230.
Unlike image
sensors, however, there is no need to have square sensels - they could have any
aspect ratio. In fact, there is some advantage to rectangular sensels for the
AF detection lines. Each detection line is 120um wide, and likely includes a
number of columns of sensels - unfortunately we cannot see how many. If there
were 10 columns, for example, each vertical detection line would have 3500
sensels total.
A second
interesting detail, is that there is masking at each end of the lines, which
has an angled edge. The skew of this edge is 15um along the length of the
detection line. This suggests to me that the columns of sensels are staggered,
to provide spatial resolution much finer than the 6um sensel size.
Here is a tight
crop from the very center of the AF sensor, showing the details discussed
above:
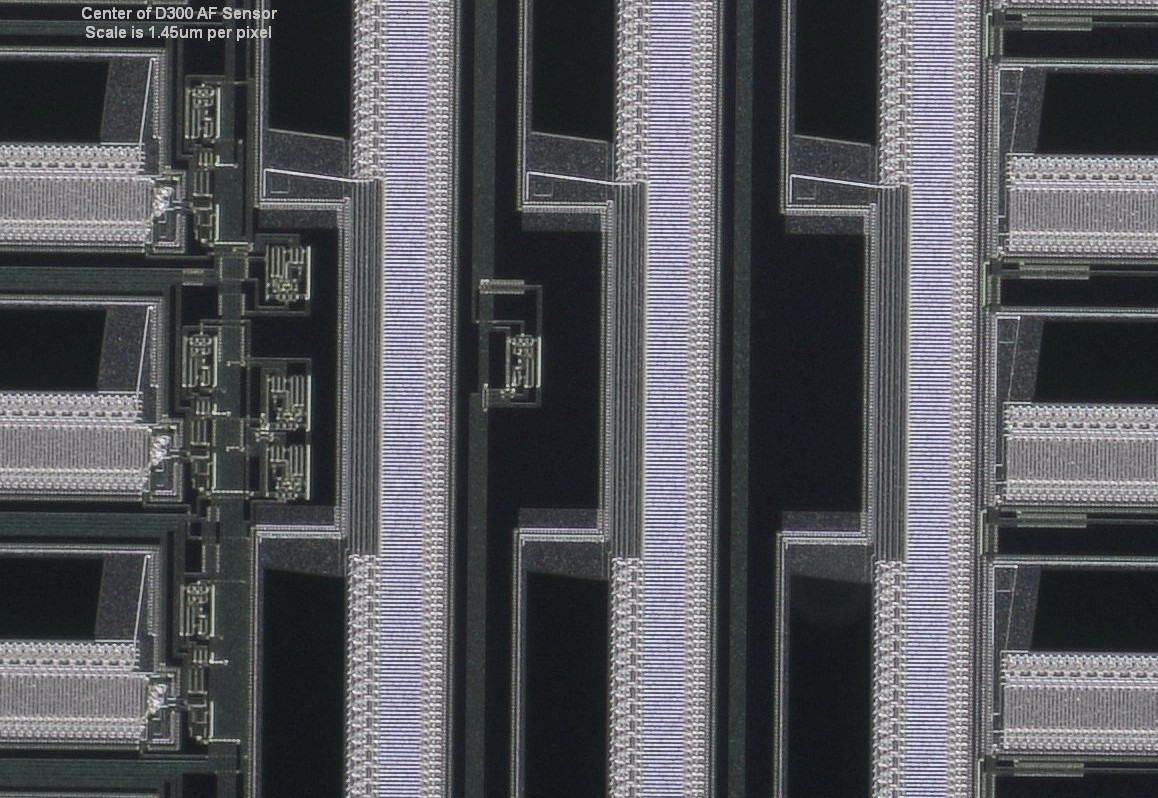
Inner ends of 12 detection lines for the center AF group. Note angled
masking, and circuitry which repeats at 6um intervals along detectors.
However, a 15um
stagger doesn't fit very nicely with a 6um sensel pitch - it isn't a nice
integer multiple. The actual size for the sensels remains a bit of a puzzle. I
would like to invite comments from others who are more familiar with the
details of IC design and may be able to deduce more from the above image.
Numbers for Focus
Precision
The field lens
masks are 8.4mm high, and the images projected by the separator lenses are
1.88mm high. This means the magnification at the AF sensor, relative to the
main-lens image, is 1/4.5.
If we are using an
f/8 lens on the camera (which matches the spread angle of the separator mask
images "projected" by the field lens), the movement of the images on
the detection lines will be 1/4.5 as much as the radius of the COC in the main
image. For example, if the main lens is a little out of focus so that it
produces a 20um-diameter (10um radius) COC in the main image, then the images
on the AF sensor's detection lines will be displaced 10um/4.5 = 2.2um. We want
the AF system to be able to detect a displacement of this size when an f/8 lens
is in use.
For wider-aperture
lenses, the requirement is much tighter. An f/1.4 lens will produce a COC
diameter that is 5.6x larger, for the same image displacement at the detection
lines; in other words the COC diameter would be 112um in the above case. To get
this back down to a 20um COC or less (which is still a bit large for a
sharp image on the D300), the AF sensor needs to be able to detect an image
shift of only 0.4um on its detection lines.
To meet this tight
spatial resolution, the detection lines would need to have at least 15
staggered columns of 6um sensels. If we allow main-image COC sizes up to 30um
diameter, then the detection lines would need just 10 staggered columns of
sensels producing 0.6um spatial resolution; I suspect this may have been the
actual design aim for the D300 AF system when using f/1.4 or similar lenses.
EOS-1Dx AF Sensor and Optics
First, a quick review of the D300 sensor and its associated
separator mask for comparison. Here is the D300 sensor, which has two
sets of vertical detection lines plus two sets of horizontal detection lines
for the center group, and just two sets of vertical detection lines for each of
the lateral groups:
D300 AF sensor
Each of the eight sets of
detection lines requires its own separator lens, so we find eight openings in
the D300 separator-lens mask:
D300 separator mask with eight openings for the eight
separator lenses.
The Canon 1Dx design adds
cross-type detection for two columns of AF points in each of the two lateral
groups (with f/4 sensitivity horizontally), and f/2.8-sensitivity cross-type
detection for the middle 5 AF points in the center column. This requires
adding two sets of horizontal detection lines for each of the lateral groups of
AF points, and four sets of detection lines to the center group. The
detection lines for f/2.8 sensitivity need to be set about twice as far from
center, as the f/5.6-sensitivity detection lines are. To minimize the AF
sensor size, these have been set diagonally away from center, so the detection
lines also need to run diagonally (photo released by Canon):
EOS-1Dx AF sensor includes a total of 16 sets
of detection lines.
All of the additions require quite a bit more real estate,
especially since the f/2.8-sensitivity lines for the center group require
moving the three groups apart some. This sensor die measures
about 15mm wide by 6.8mm high (note all dimensions are inferred from photos and
may not be exact). To save a little space, the line sets for the lateral
groups have been crowded a little closer; this requires the separator lenses
for those groups to be slightly prismatic, to re-aim their rays closer
together.
If you check dimensions carefully in this photo, you can
see that the center-to-center spacing of the horizontal-line sets for the outer
groups, is about 1.4x the center-to-center spacing of their vertical-line
sets. This is because the outer cross-type AF points have f/4
sensitivity horizontally, but f/5.6-sensitivity vertically.
Another interesting detail, is the length of the detection
lines for the f/2.8-sensitivity AF points (diagonal lines). These only
serve a single AF point each, yet they are about as long as the horizontal
lines for the center group, which each serve 3 AF points. This extra
length is very useful for f/2.8 AF points, as otherwise the out-of-focus
detection range would be very narrow.
I have not found any photos of the separator mask for this
sensor, but have put together my own educated guess. The locations of the
openings (relative spacings) should be fairly accurate, but the sizes and
shapes of the openings are just my speculation (and I've used the D300 shapes
for convenience). It's reasonable to expect that the mask openings for
the f/4-sensitivity and f/2.8-sensitivity separator lenses will be larger since
there is space on the main lens exit pupil for larger patches, further from
center:
Mariannes's separator mask design for the EOS-1Dx (not
patented).
On the separator mask, the spacings between pairs of mask
openings must all be exactly scaled to the size of the aperture circle on the
main lens which they correspond to. Thus the openings for
f/4-sensitivity are Sqrt(2) times further apart than the f/5.6-sensitivity
openings, etc.
Here is a look at how the camera lens exit pupils are
used by the D300 and EOS-1Dx AF systems. The D300 only uses
(approximately) the f/8 circle, whereas the 1Dx uses the f/5.6, f/4 and f/2.8
circles. The 1Dx field lenses are aimed so that all six of the mask
openings for vertical detection lines (f/5.6-sensitivity) come from exactly the
same two patches on the main lens exit pupil. Also, the four f/4-sensitivity
mask openings for the lateral-group horizontal lines will share two patches:
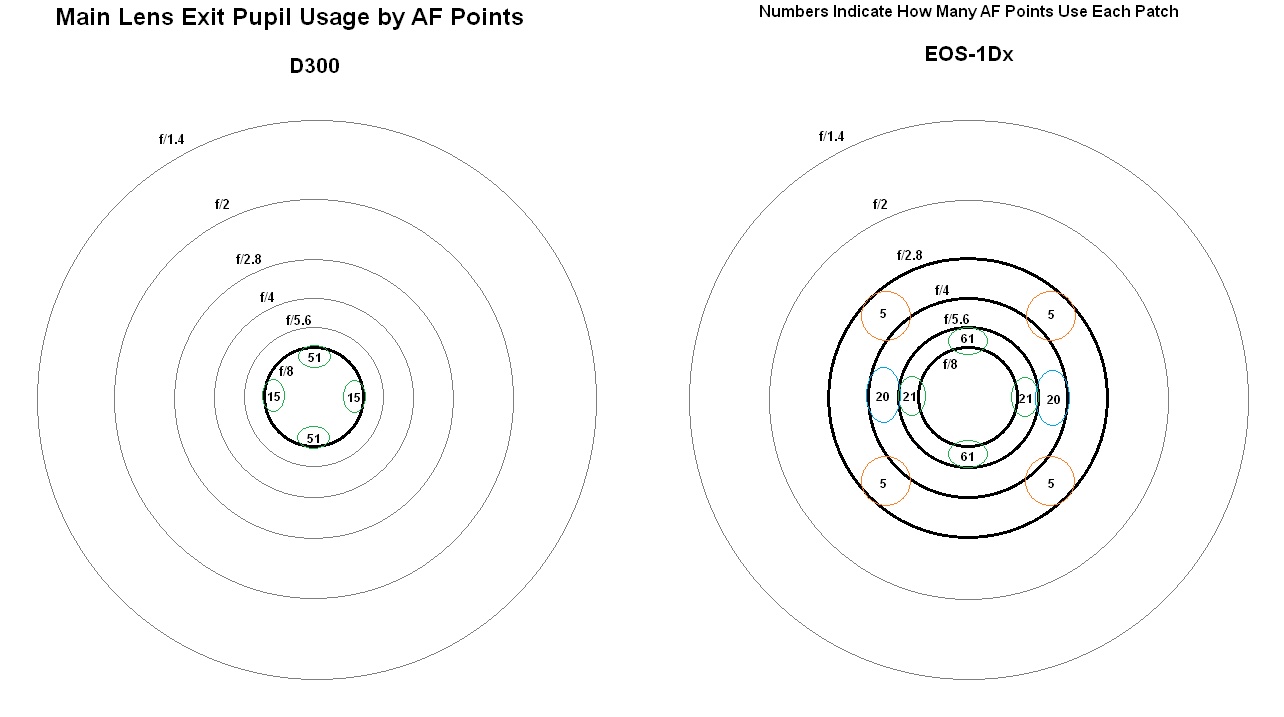
Main-lens exit pupil patches used by D300 and 1Dx AF systems (see full-sized
image for clarity). Sizes and shapes of the patches shown are only approximate.
For
perspective, I have shown aperture circles up to f/1.4. This underscores
the baseline disadvantage for an AF system that is (nearly) restricted to using
the f/8 circle.
Since
the EOS-1Dx also uses 3 field lenses, the exterior appearance of the complete
AF module is very similar to the D300/D3 module (photo released by Canon):
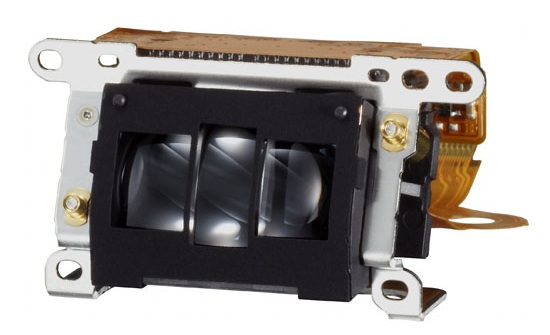
EOS-1Dx AF modules (Canon photo).
The sizes of the field-lens masks correspond to the sizes of
the AF-point arrays for the three groups: Center array is 7 high by 3
wide and outer arrays are 5 high by 4 wide. Note that the field lens
masks are unaffected by the design choice of AF-point sensitivity (f/5.6 vs f/4
vs f/2.8).
Demonstration: AF sensor image brightness versus lens aperture
Here,
the D300 AF module is set up with the 200 f/2 VR, looking at a subject about 7
feet away. The images projected onto the AF sensor are made visible by
substituting a piece of matte transparent tape for the sensor. These were
photographed by my D800E with a macro lens and exposure set to Manual.
A second camera was used to photograph the lens aperture
from the front, to provide a means of measuring the f-stop setting. As a
bonus, in these photos we can also see the separator mask openings projected
onto the lens pupil.
The lens aperture lever was held by a cardboard wedge -
first, near wide open (almost f/2), and second, stopped down to the point where
one can just see some corner vignetting start to occur in the sensor
images. The f-stop for the second case turns out to be about f/7.5, which
is where the lens aperture diaphragm is just starting to cover the outer edge
of one of the separator mask openings.
The primary result from this demonstration, is that the
brightness of the images on the AF sensor is unchanged (other than the slight
vignetting mentioned above). This demonstrates that none of the extra
rays from opening the lens wider than f/7.5 are arriving at the AF sensor.
It is also interesting to note that with the lens wide
open, there are some areas of flare occurring. With the lens stopped
down, the flare is absent. In this composite, the left side shows the 200
f/2 front view when almost wide-open and the AF sensor images for that
aperture; the right side shows the lens stopped down to about f/7.5 and the
corresponding AF sensor images:
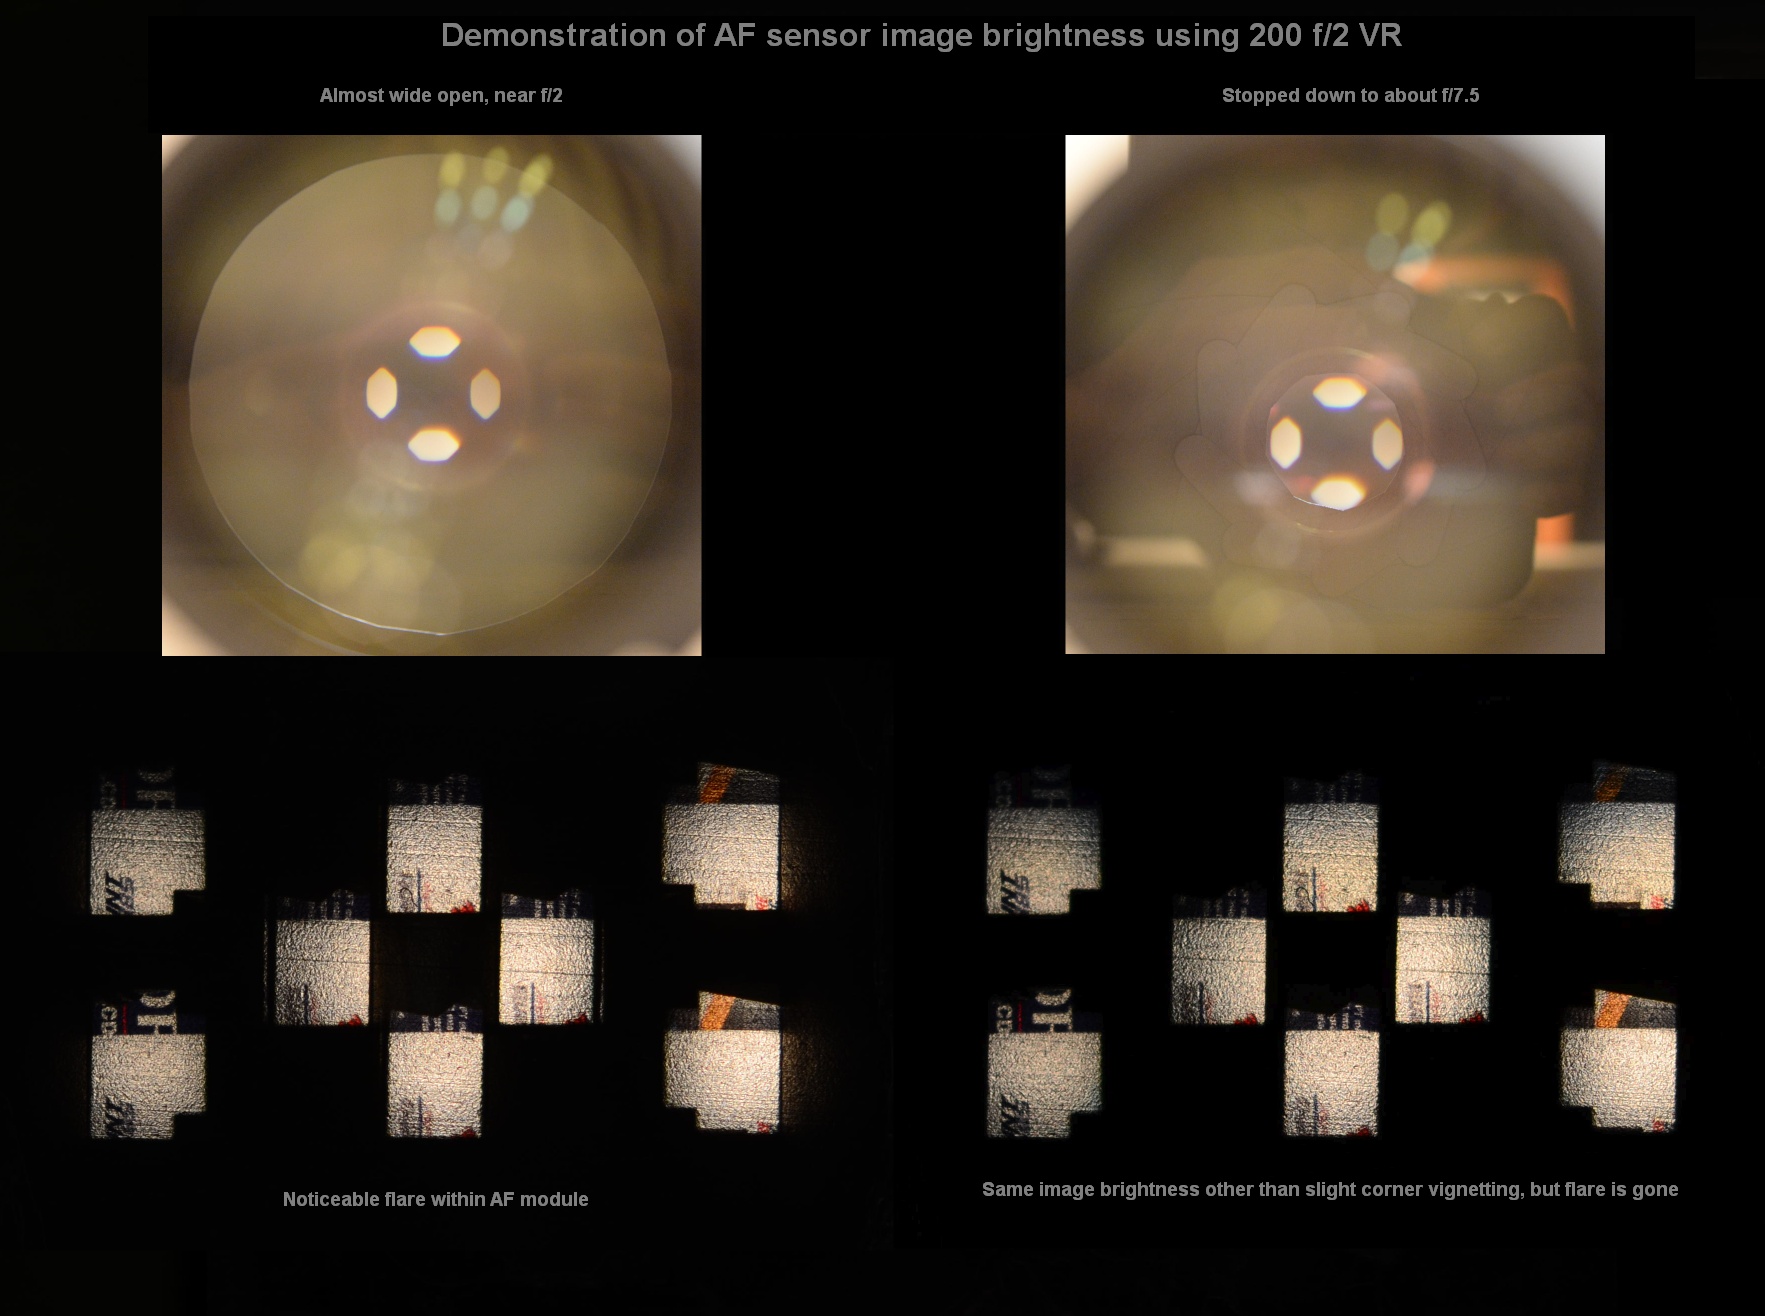
If the lens is stopped down
beyond f/7.5, the AF sensor images very quickly fade to black as the lens
diaphragm covers the separator-mask openings.
Demonstration: Image Shift at AF Sensor, by Focus
Today
I replaced the "projection screen" on the D300 AF module, in an
attempt to improve the visible image detail. Instead of frosty cellophane
tape, I'm using a solid piece of clear plastic which I have filed on one side
to produce a sort of "ground glass" surface. There is still
quite a bit of texture visible, but I think it is possible to see more image
detail now.
This demonstration will give the actual image shift in
microns, for a change in lens focus. The setup is much the same as for my
immediately preceding post: The 200 f/2 is aimed at a target about 7 ft.
away, with the D300 AF module positioned behind it. The images projected
by the separator lenses, onto the screen, are photographed by the D800E with a
macro lens, at 1:1 magnification.
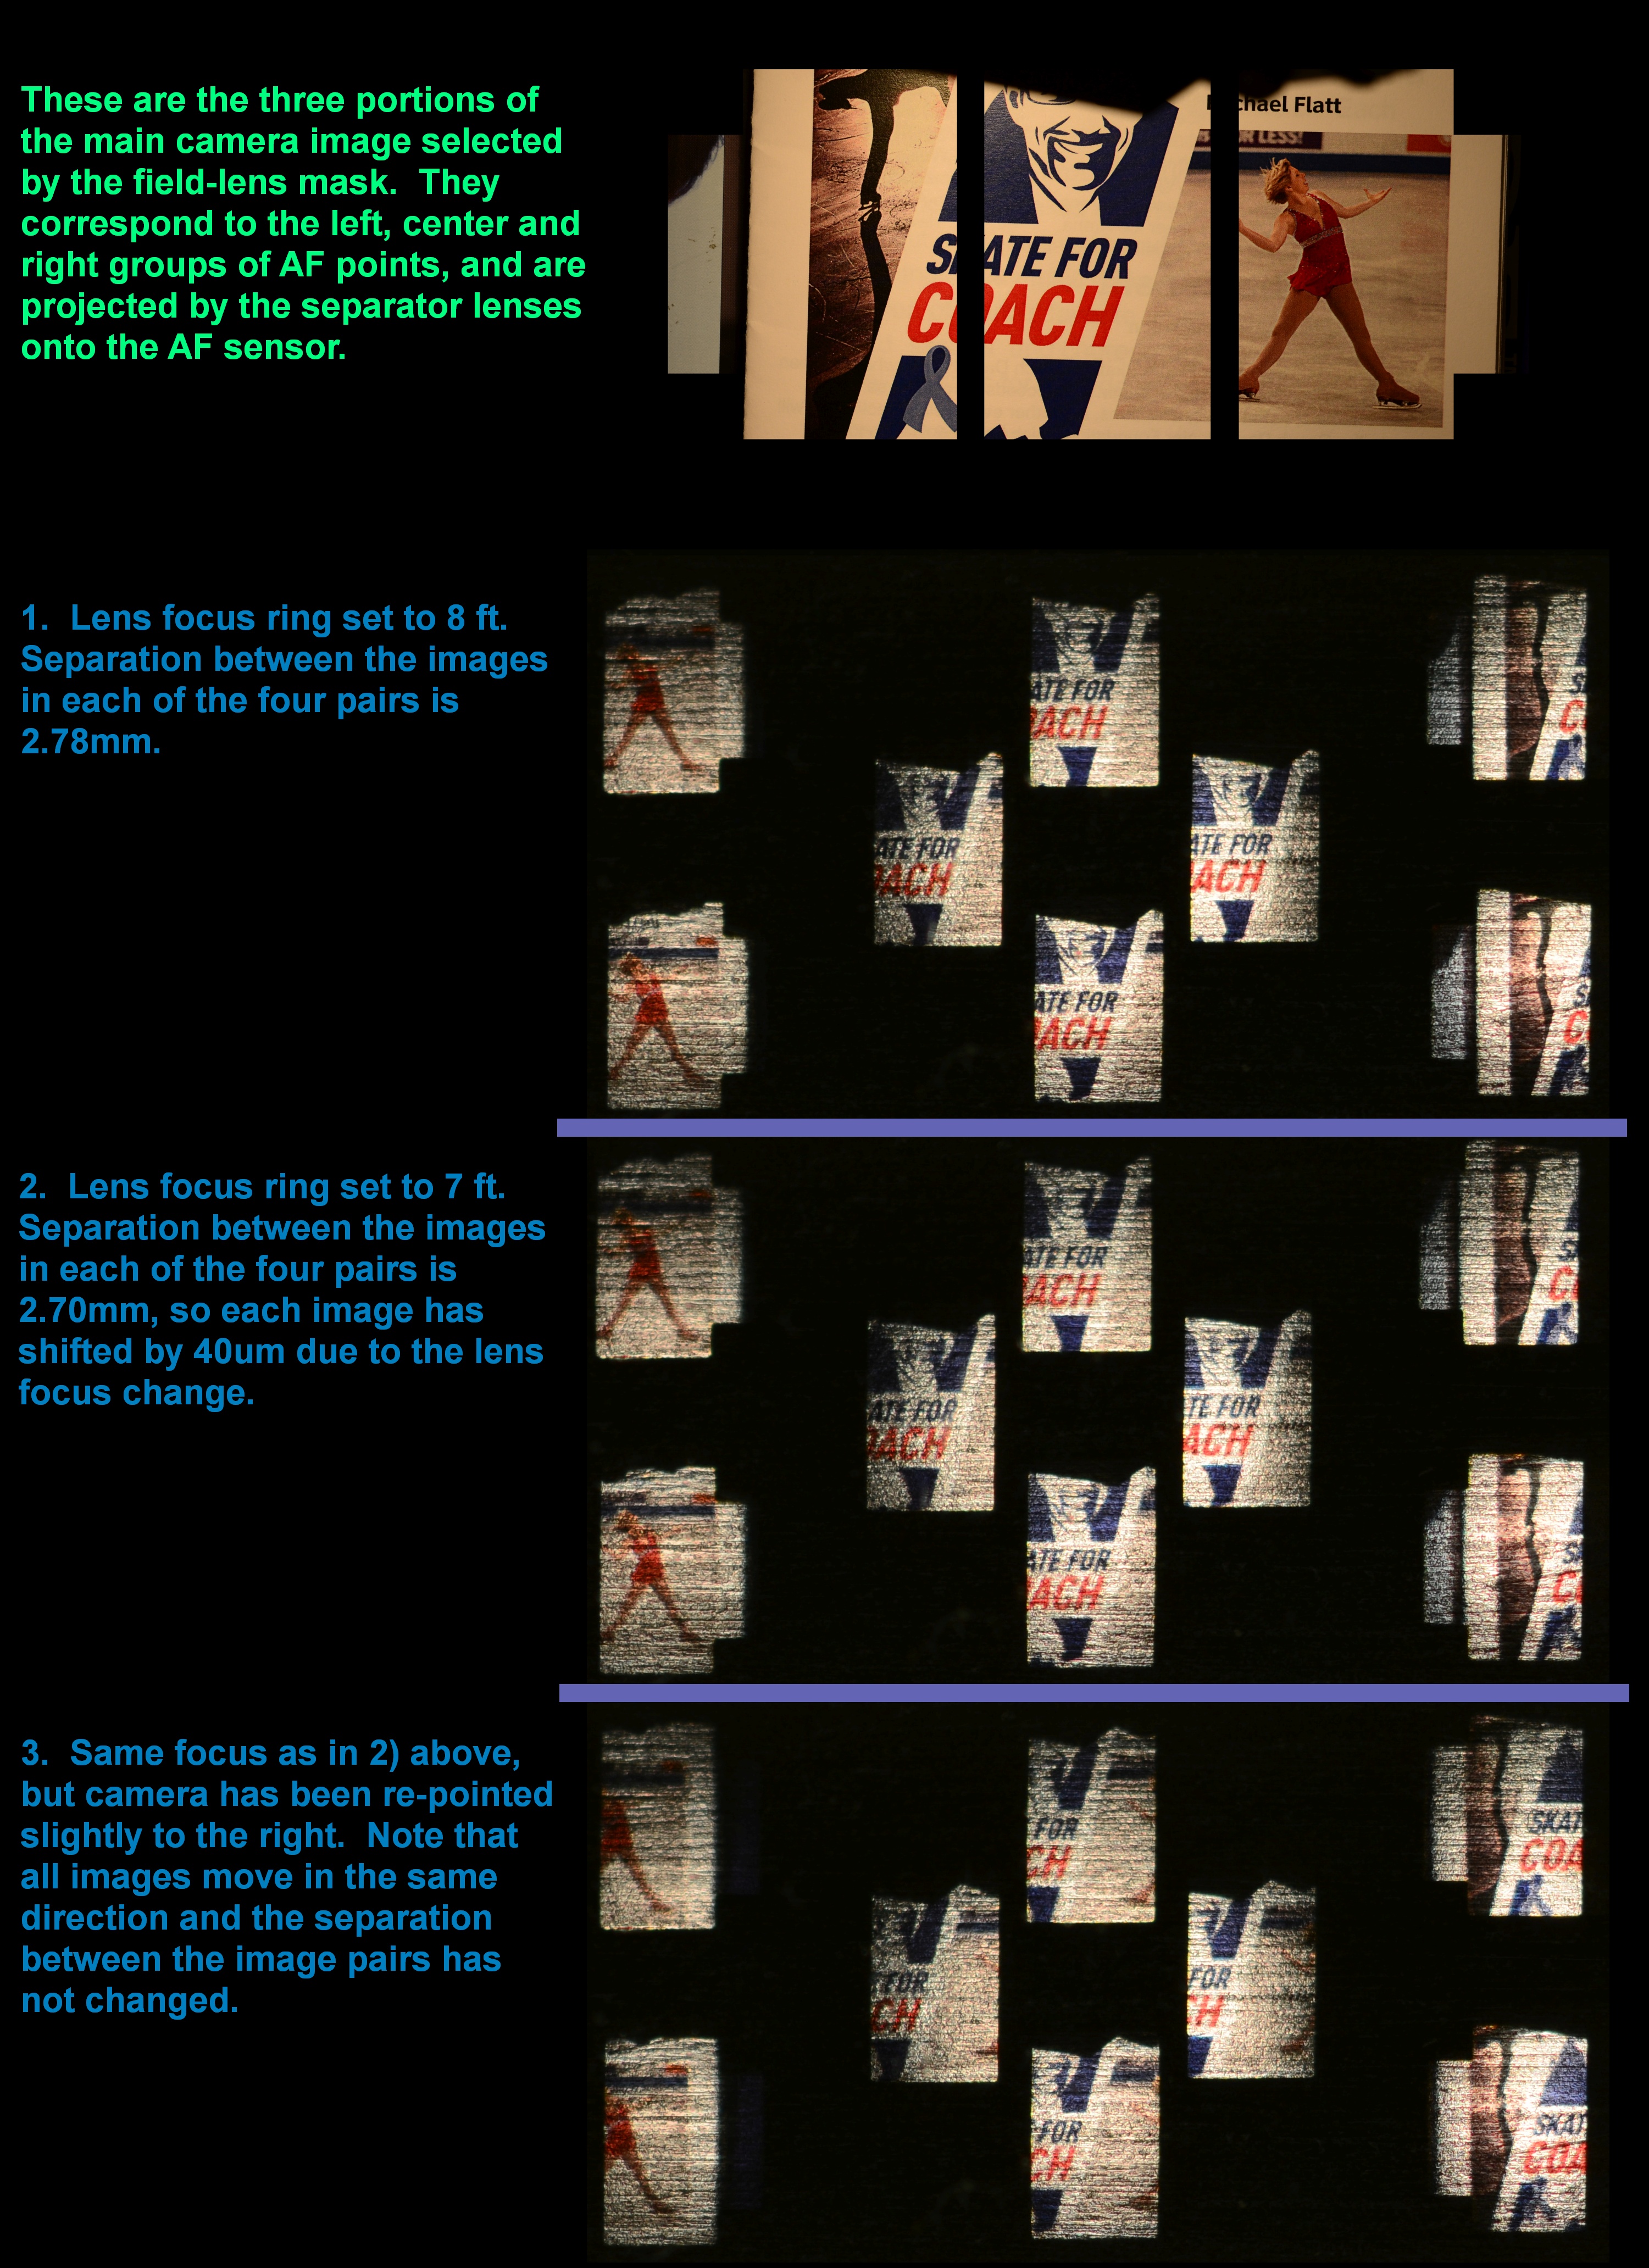
In the following composite, three examples of sensor
images are shown (at 50% resolution). The first was taken with the lens
focus ring set to the 8 ft. position. In this case, the separation
between the separator-lens images in each pair, is 2.78mm.
The lens focus ring was then moved to the 7 ft. position
for the second example. The separation between the images in each pair
reduces to 2.70mm, a reduction of 80um, so each image has moved 40um (0.04mm)
towards the other image in its pair.
For the third example, the lens focus was kept the same,
but the lens was re-pointed slightly to the right. This demonstrates that
all eight images move in the same direction when the subject moves, and the
separation between the image pairs does not change.
The composite also includes a crop of the image taken by
the camera through the 200 f/2. This crop shows the three areas which are
selected by the field-lens mask; you will see that it is these three areas
which are projected onto the AF sensor:
Looking carefully at these separator-lens images, you may
notice that the focus has become slightly softer by changing the lens focus
ring from the 8 ft. position to the 7 ft. position. This amount of
defocus is considerably less than one sees in an image taken with the 200 f/2,
even if it is set to f/8, when changing the focus ring between those two
positions. In fact, the focus change seen here is very similar to
what one sees in the camera image, if the 200 f/2 is set to f/22; this
demonstrates the high depth of focus for the AF system, which is due to the
small size of the patches on the main lens exit pupil that are used.
Calculated Image Shift
We can compare the 0.08mm shift in relative image
positions, to the expected value that we calculate. When changing focus
from 8 ft. (2438mm) to 7 ft. (2134mm), the 200 f/2 moves its image plane by
1/(1/200 - 1/2134) - 1/(1/200 - 1/2438) = 2.81mm along the optical axis.
Since the AF system is using the f/8 circle, the lateral shift at the image
sensor is 2.81mm/8 = 0.351mm. However, the D300 AF module scales the main
image down by a factor of 4.5 for the AF sensor, so the shift seen at the AF
sensor is 0.351mm/4.5 = 0.078mm, which compares well to the observed figure.
Flare Control
If
you have read a few of my previous posts here, you are aware that the AF system
is very selective about the light that it admits to the AF sensor, and only
passes rays that come from the central f/5.6 or f/8 circle of the main
lens. This means that when wider-aperture or "faster" lenses
are used, there are quite a few extraneous rays shooting around inside the AF
module.
We will take a look at what is happening inside the AF
module housing, between the field lens array, and the separator-lens
mask. To do this, I have removed the field lens array from the module
housing, and set it up on a macro rail with an f/2 lens, and a screen placed exactly
where the separator-lens mask would be (21mm behind the field lenses):
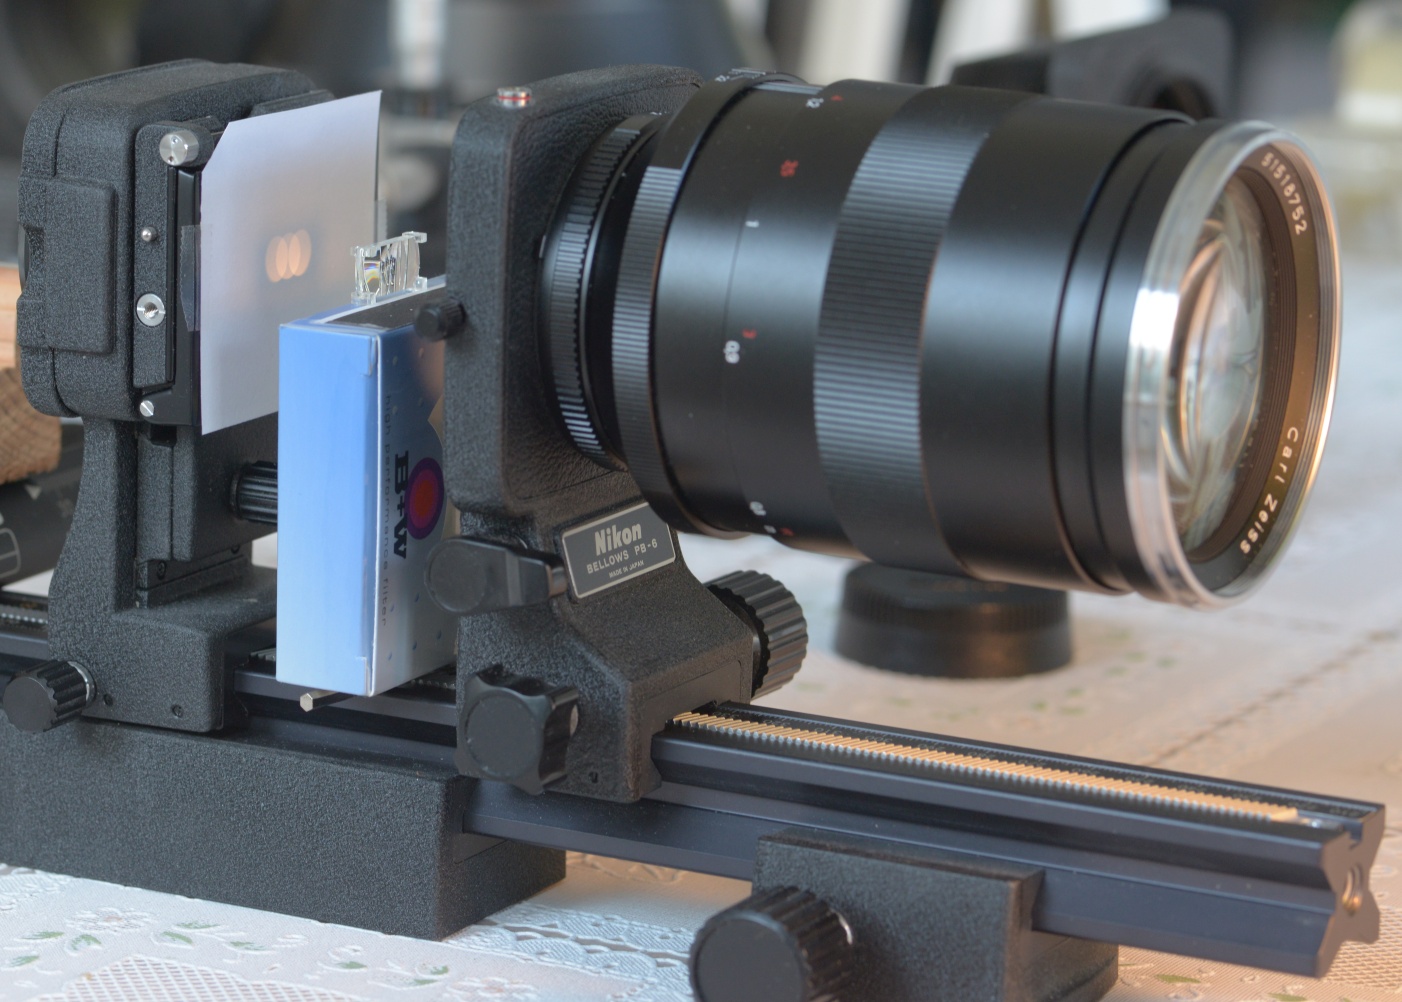
Field lens array (sitting on blue box) projecting the main
lens exit pupil, onto the plane of the separator-lens mask (white screen).
I photographed the field-lens projections at a number of
different aperture settings of the main lens, from f/8 to f/2. In order
to see the screen, the camera needed to be placed at a rather steep
angle off-axis, so the photos are in perspective.
Recall that the field lens projects the main lens
exit-pupil plane, onto the plane of the separator-lens mask, so we will see the
shape of the lens diaphragm. In the first example, for f/8, the circles
are outlining the areas where the separator-mask openings are; keep this in
mind as a reference (I had wanted to place an actual-size copy of the separator
mask on the screen, but decided that accurate alignment would have been
too difficult).
As the main lens is opened wider, the field-lens
projections become wider in proportion, until they achieve a wide overlap at
f/2:
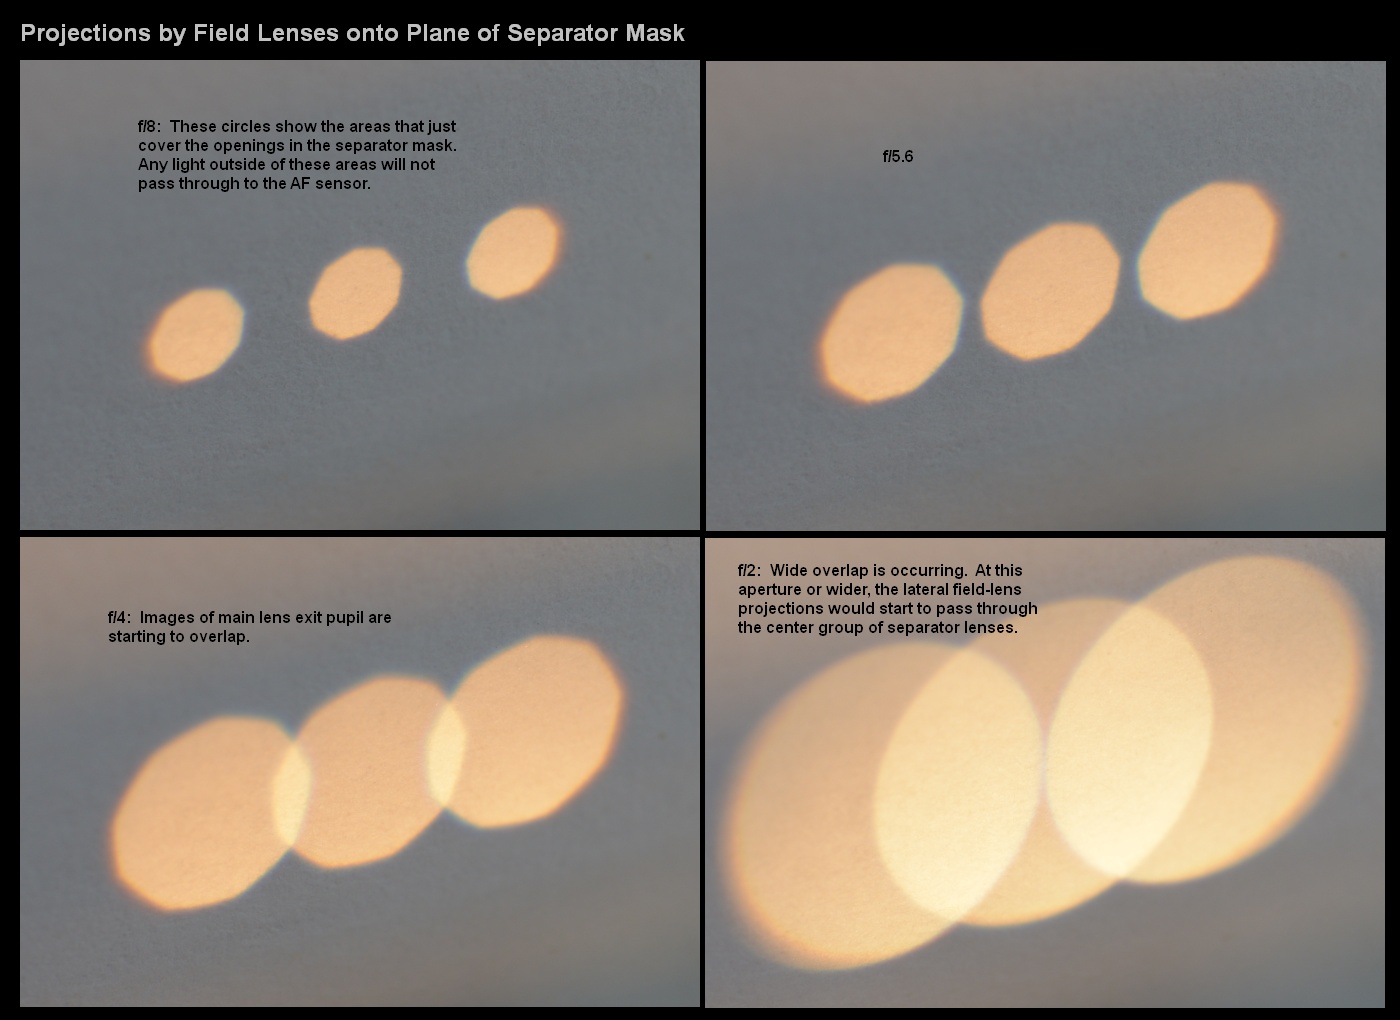
Images of the main lens exit pupil, projected by the three
field lenses, onto plane of separator-lens mask.
Of
course, an f/1.4 lens would produce even larger circles. We see that the
"fast" lenses would cause quite a problem, by mixing up light between
the different field lenses.
To
prevent this, and generally reduce flare from wide-aperture camera lenses,
barrier walls are placed between the field-lens optical paths within the AF
module housing:
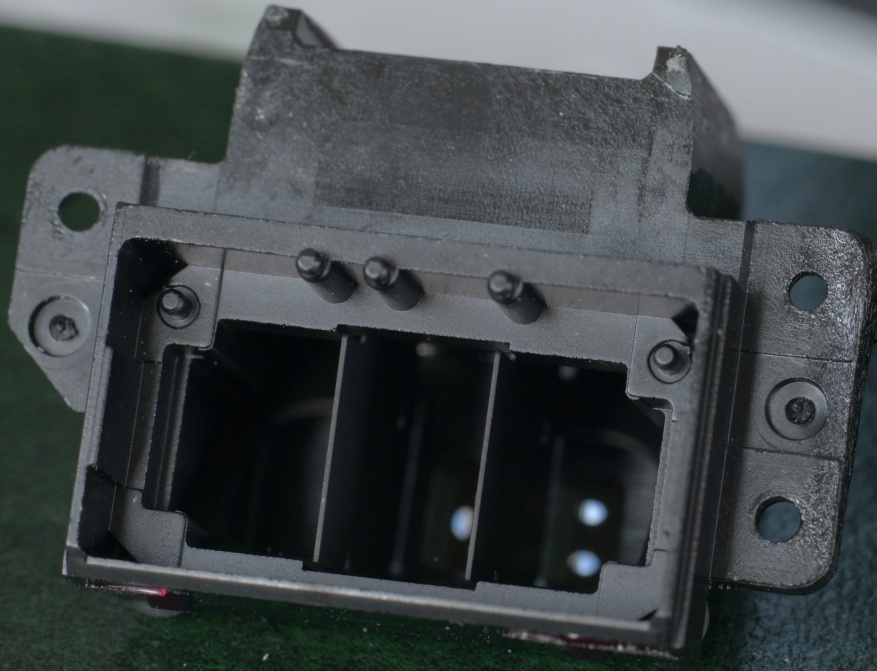
AF module with field-lens array removed, showing interior
barrier walls between field lenses.
Although the AF module is well-equipped with these internal
black walls, they are not quite as non-reflective as some other surfaces, such
as the inside of the camera's mirror box. Thus we can see noticeable
flare from wide-aperture lenses (see prior post).
Module Alignment - a Warning
Let's take a close look at a
photo I posted previously:
On the upper right pane, note slight
eclipsing of lower separator-mask opening by the lens diaphragm.
When setting up for this photo, it was extremely difficult
to achieve precise alignment of the AF module, to the center of the main lens
exit pupil. Here we can just start to see the effect of the residual
misalignment, presenting as mild vignetting of the upper images at the AF
sensor. For reasons I will discuss in more detail later, one does not
want any discrepancies in the brightness of the two images in each pair, so
this kind of off-center vignetting needs to be avoided as much as possible.
The angles that the separator-mask images make with the
optical axis range from 2.0 deg. to 3.6 deg. (that range covers the radial
width of the openings). In order for the images to remain well-centered
in the lens aperture and avoid vignetting when the main lens is at - or
even a little under - the minimum design aperture, the angular alignment of the
AF module must be kept within a very small fraction of one degree.
To accomplish this (and also allow for fine-adjust of the
AF module position along the optical axis), the module is suspended from its
top frame by three fine-thread alignment screws which are spring-loaded:
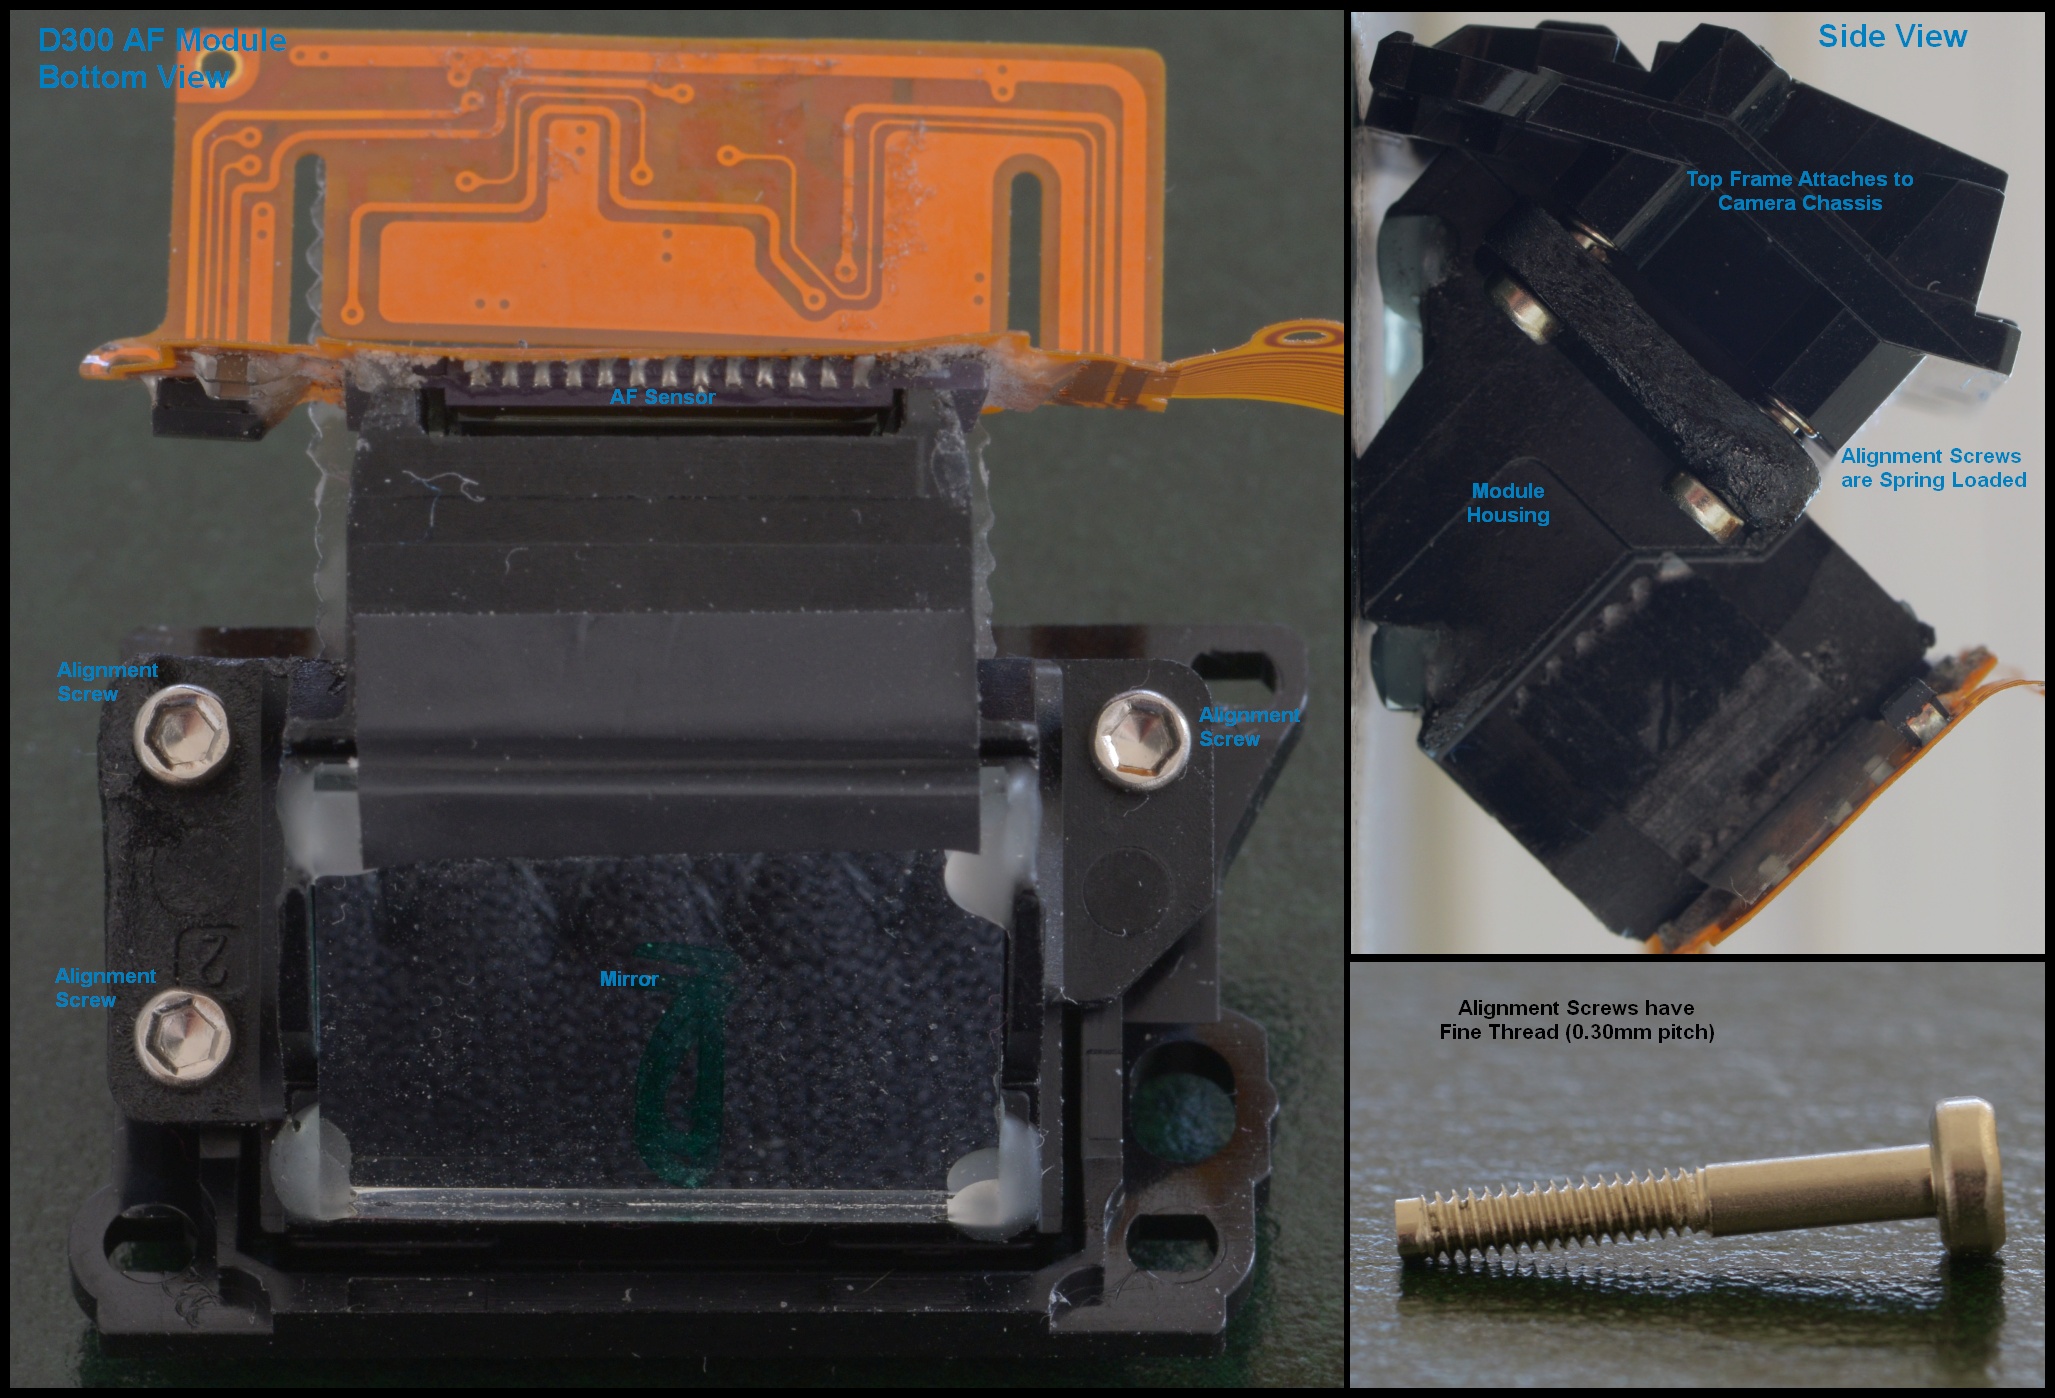
AF module alignment provisions
The fine thread of the alignment screws provides movement
of less than one micron, per degree of rotation. These adjustments are
performed at the factory, and are interactive with the adjustment for the AF
sub-mirror in the mirror box.
Unfortunately, many authors on the web have suggested use
of the AF sub-mirror rest-stop adjustment as a means of global AF-error
compensation. Changing the position of this stop throws the alignment of
the viewfinder AF points out, and can result in loss of AF performance when the
main lens is close to the AF-system minimum aperture (f/8 for the D300):
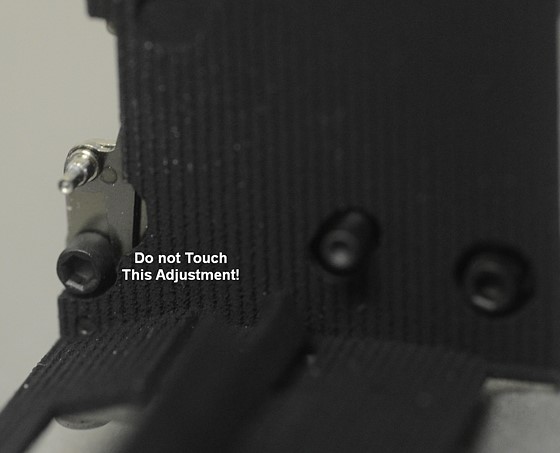
This is not a global AF adjustment and should never be used
as such.
That small adjuster at the back of the mirror-box, just above
the base, can only be set up correctly by running firmware on the camera that
allows the AF-sensor images to be checked. If it is disturbed, there is
no means for an owner to ensure that it is accurately returned to its original
position.
AF Sensor Detection Lines
As
discussed in prior posts, the AF sensor has 11 pairs of vertical detection
lines which serve all 51 AF points, and 5 pairs of horizontal detection lines
for the central group of 15 cross-type sensors.
Each vertical detection line is 2.08mm long, but the image
projected onto it is only 1.88mm high, leaving an alignment margin of 0.2mm
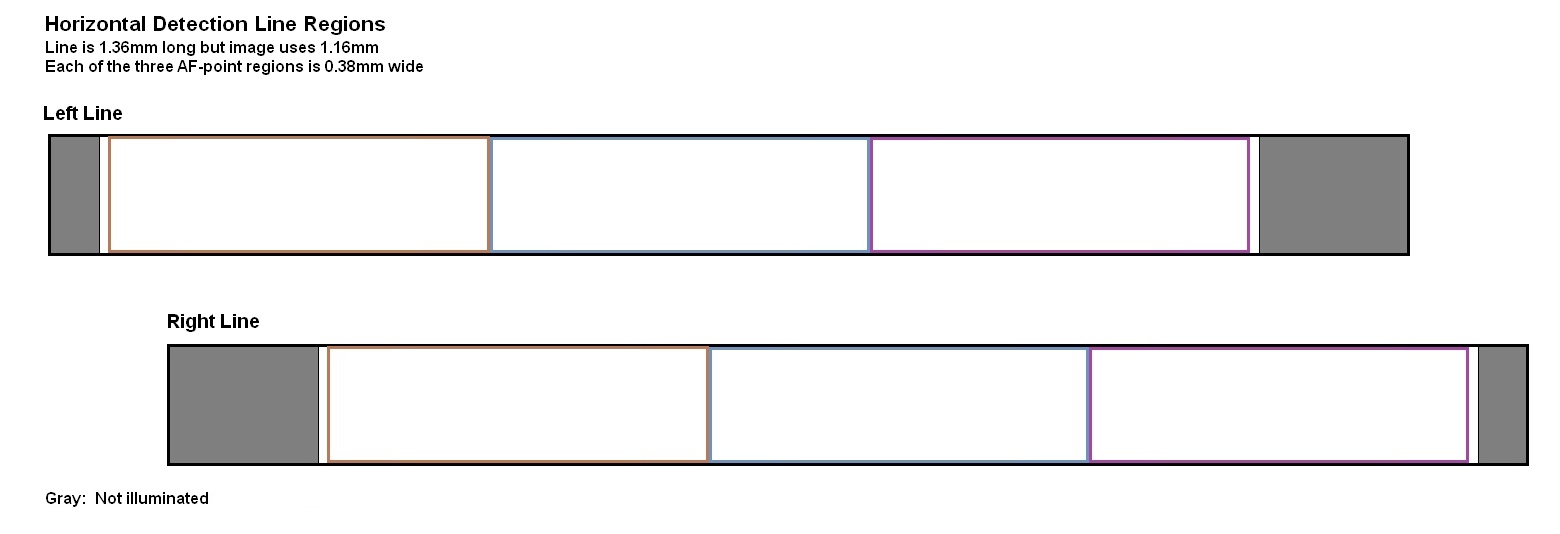
total. Similarly, each horizontal detection line is 1.36mm long, but the image
projected onto it is 1.16mm wide, again leaving 0.2mm of alignment margin. Both
types of lines are 0.12mm wide.
Vertical lines are divided into 5 regions, for the 5
AF-point rows which use them. The spacing between these regions, i.e. their
height, is precisely defined by the spacing between the horizontal detection
lines (at least for the center group of 15 AF points), which is 0.36mm. The
Horizontal lines are divided into 3 regions since they serve three columns of
AF points in the center group. The spacing or width of these regions (defined
by the spacing between vertical lines) is 0.38mm.
It is also worth mentioning that the spacing between the
images projected onto the AF sensor by the separator lenses is slightly wider
than the spacing between opposite groups of detection lines. This gives the
images an outward shift of about 0.05mm on each side, rather than being
precisely centered on the detection lines. I believe this is likely by design,
rather than merely being a manufacturing tolerance; more about this later.
When the camera lens is in focus (and when using AF-S
single-point AF), the horizontal and vertical spans where image detail is
recognized for each AF point (i.e., where it is simultaneously visible on both
left and right horizontal lines, or on both top and bottom vertical lines), is
about 0.24mm wide or high. We now have a frame and dimensions for the
individual AF-point regions, that we can use to discuss processing of the data
taken from the detection lines. Here are the regions for the horizontal
detection lines:
Each of the 10 horizontal detection lines is divided into 3
AF-point regions. Also note image offset.
[Note: Relative positions of lines shown in this diagram
is only for reasons of compactness, and does not reflect their physical layout
on the sensor, where they are in fact co-linear and well separated.]
Establishing a Model
Not all details of the sensel layout on the detection
lines are known at this point. It appears that they have a 6um pitch, but there
is an unknown number of sensels across the 0.12mm width of the lines. It is
also not known how the columns of sensels are staggered, and what spatial
resolution results.
In order to continue the discussions, I have decided to
use a simplified model of the detection-line sensel layout. The actual AF
module will probably have better performance (precision and accuracy) than our
model, so keep this in mind for the following discussions.
The model has a 6um sensel pitch, but each sensel is
assumed to cover the full width of the line, so its dimensions will be 6um by
120um. Rectangular sensels such as this are likely used in a number of AF
sensor designs. The data read from the detection lines is thus strictly
one-dimensional; any image detail variations across the width of the
line will be averaged out.
Each AF-point region on a horizontal detection line will
include about 63 sensels, and on the vertical detection lines will include 60
sensels. The 0.24mm span within each AF point, containing image detail
recognizable when the camera lens is at an in-focus position, will include 40
sensels; this is an important number and establishes the size of the data set
used in calculating image correlations for focus-error determination.
The final assumption for our model, is that the range of
data to be used when determining image shift from defocus, will be limited to
the sensels within the selected AF point, plus only a few outside of that region.
It is likely that the actual camera will go beyond this range in certain cases,
although of course it will always be limited by the boundaries of the images
projected onto the AF sensor.
Evaluating Image Shift
As has been shown in previous posts, the images projected
onto the detection lines will move away from each other if the lens focus is
moved toward infinity - or toward each other if the lens focus is moved closer.
When the camera lens is in focus (barring any calibration modification such as
AF fine-tune), the AF-point region on the left detection line will see exactly
the same image details as the corresponding AF-point region on the right
detection line does.
Alignment of image details is shifted when lens is out of
focus (note image boundaries do not move).
It is a very simple matter for us, with our visual cortex
optimized for image recognition, to immediately determine the amount of image
shift - which gives the direction and amount of the focus error.
The AF processor, however, must execute many steps to
determine this, scanning the full range available within the AF point and
checking for a match between the left and right image samples.
In our model, each step will require 40 value comparisons
(one for each sensel in the 0.24mm span). To investigate the full width of the
AF-point region (plus a bit), we will shift the test span in the left line from
13 sensels to the left of centered, to 13 sensels to the right of centered (the
test span in the right line is moved in the opposite direction). For best
resolution, we can shift the left and right test spans one at a time, giving a
total of 53 steps to evaluate. For each step, we record a value which indicates
how well the image samples within our test spans match.
Continued in next post . . .
Correlation Functions
The
processing of data from the AF sensor starts with reading out the values from
the detection lines. Here, I am limiting the discussion to a single AF point,
which will be one of the central cross-type points equipped with both
horizontal and vertical detection lines. We will work with the horizontal
detection lines first.
Using our model as discussed previously, the
detection-line sensels act to average out the detail across the 0.12mm width of
the detection line. That is, the 2D image data is reduced to just one
dimension.
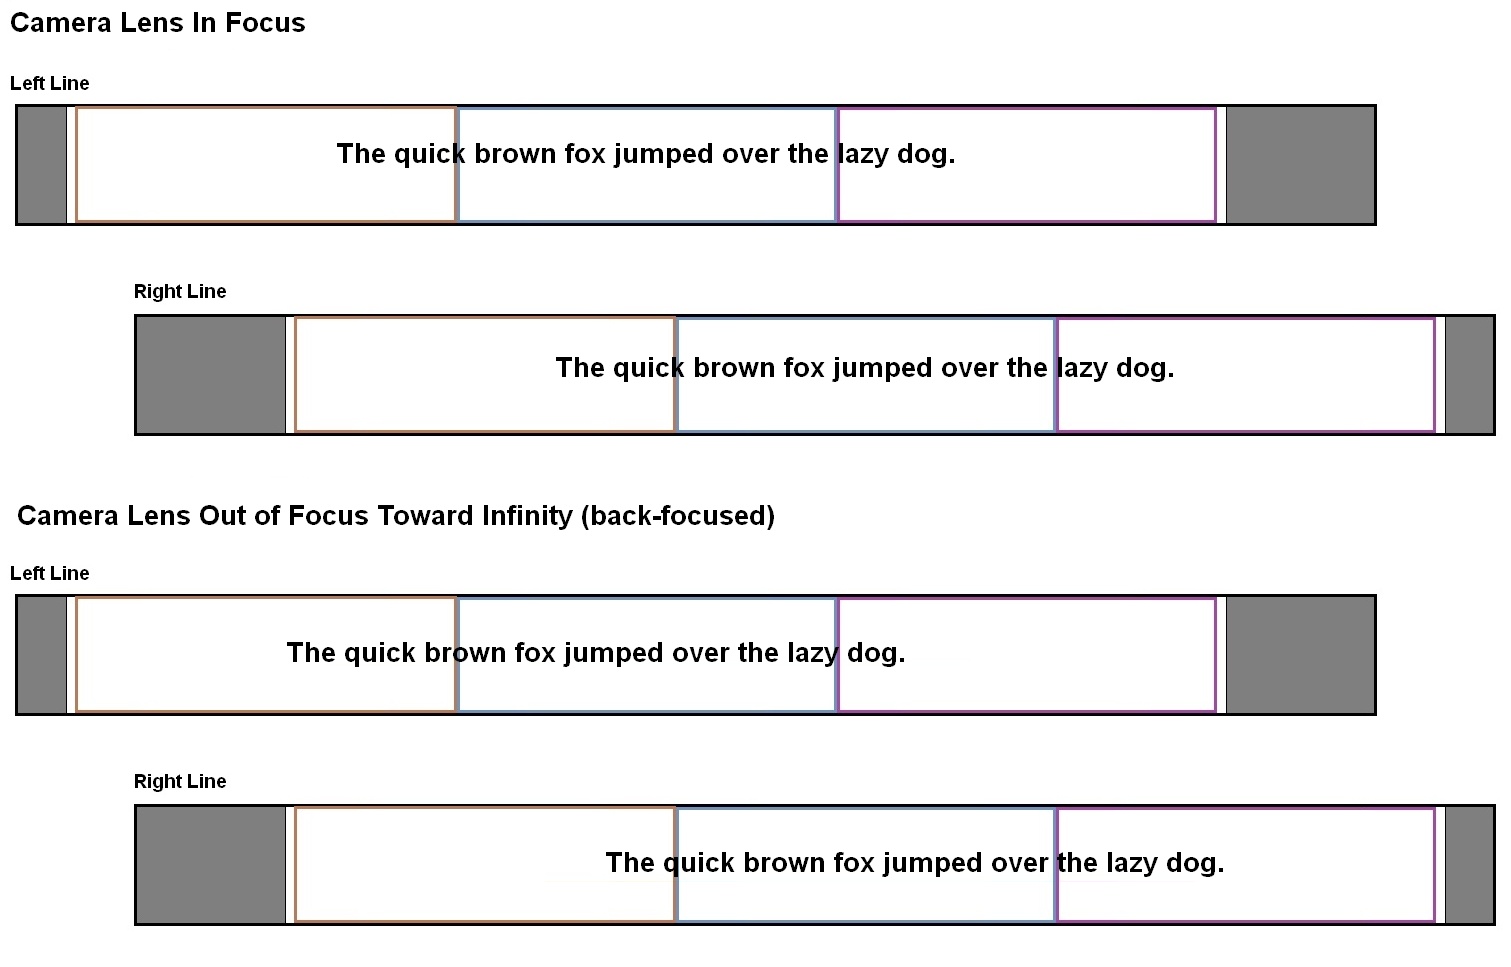
As an example, I used some fairly small text which is only
tall enough to span about half of the horizontal detection-line width; about 8
characters of the text fit into the AF-point box in the viewfinder. Comparing
to the "quick brown fox" text in the previous post (which is really
too fine for good AF), it would be about 2-3 times larger.
To simulate the function of the detection line, I
photograph the text, then extract the average row data from the RAW file, using
my image-analysis utility. The window for this extraction is 20 sensels high
(corresponding to the 0.12mm detection-line width) and is 66 sensels long. This
length includes enough sensels for the 40-sensel test span, plus another 13
sensels at each end to allow for that much shift. The 66 sensels take up about
0.40mm along the detection line (slightly more than the 0.38mm allotted to each
AF point).
Due to the small size of the text, plus the fact that it
only covers about half of the detection-line width, the contrast in the data
from the detection lines is not very high. Here are plots of the 66 values from
each line (left line in blue, right line in red):
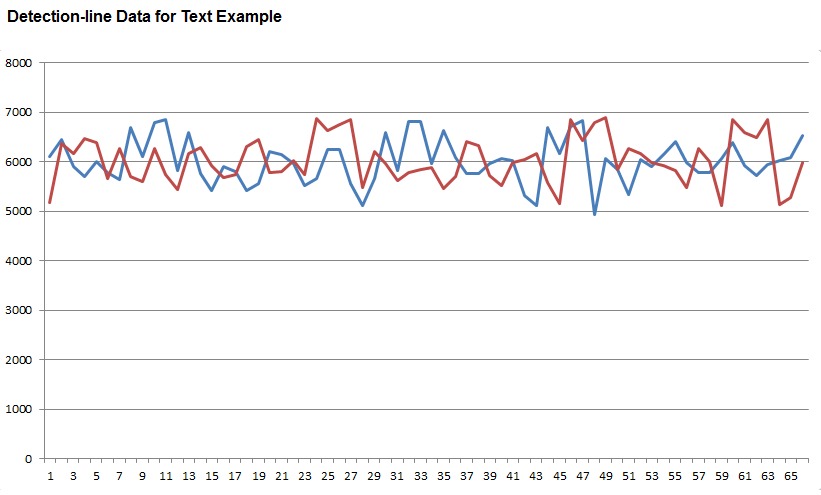
The 66 values read from each horizontal detection line, for
a fine-text subject.
At first glance, this tends to look like random noise,
especially since the data come from two separate images which do not have the
same sensel alignment to the image (causes some discrepancy in the fine
shapes). If one takes a little time and looks closely, some matching features
can be identified. (Hint: Shift the blue line to the right, and red line to the
left, 8 positions.) This data will definitely pose a challenge for the AF
processing to identify the shift.
Let's say that the values for the left line have been
loaded into a 66-element array A[] and the values for the right line have been
loaded into another 66-element array B[] residing in the processor's memory. We
refer to the individual values as A[0] to A[65] and B[0] to B[65].
Performing the Correlation
Thanks to details provided earlier by Bernard Delley from
a Nikon patent, we can apply the same correlation approach specified by Nikon.
The test span used by our model is 40 sensels wide, so we will take 40
contiguous data values at a time from the left line, and compare them to 40
contiguous data values from the right line.
The criterion used for comparison is simply the absolute
value of the difference between sensel values. For each step in the process, we
calculate the 40 absolute differences, then add them together; this sum is the
correlation value for each step. When all steps are complete, we can plot the
correlation values as a function of the test-span shifts that we used.
First step looks at the first 40 values in the A line and
compares them to the last 40 values in the B line; that is, we are taking
A-line values starting with a 13-sensel left shift from center, and taking
B-line values starting with a 13-sensel right shift from center. The first
correlation value is thus
C(-13) = Abs(A[0] - B[26]) +
Abs(A[1] - B[27]) + . . . + Abs(A[39] - B[65])
The next one will be
C(-12) = Abs(A[1] - B[25]) +
Abs(A[2] - B[26]) + . . . + Abs(A[40] - B[64])
Note that as the A[] indices go up, the B[] indices go
down; our test spans are moving in opposite directions (toward each other, to
start). When we have completed half the steps, the test spans will both be in
the center; after that they will move apart again. The last step will be:
C(13) = Abs(A[26] - B[0]) +
Abs(A[27] - B[1]) + . . . + Abs(A[65] - B[39])
We can also "squeeze in" an intermediate step
between each of the above 27 steps, if we only change one of the indices
(instead of both) at a time. This improves spatial resolution, and gives us a
total of 53 correlation values to use. I call these intermediate values
C(-12.5), C(-11.5), etc.
The C() values that we compute will be large if
the image samples in the test spans do not match, and will
be small if the image samples in the test spans have a good match.
When we plot the C() values, we are looking for the place on the curve that is
lowest.
I created a spreadsheet which does all of the above
correlation calculations, from the line data extracted by the image-analysis
utility. Without further ado, here is the correlation curve for the line data
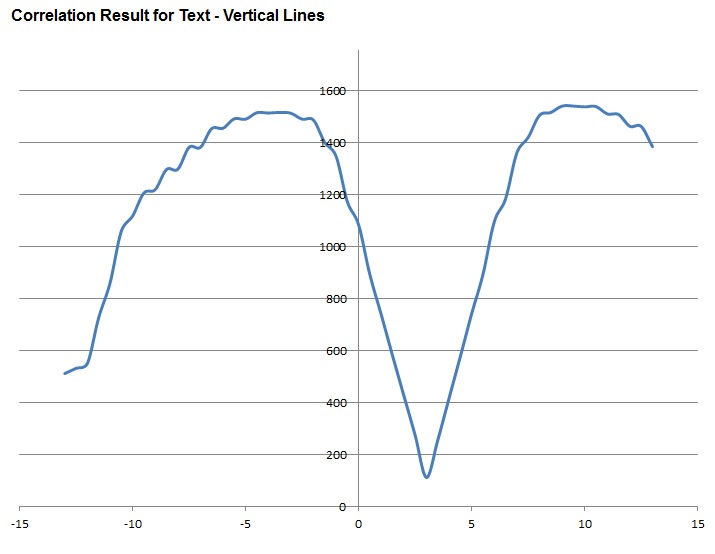
shown in the plot above:
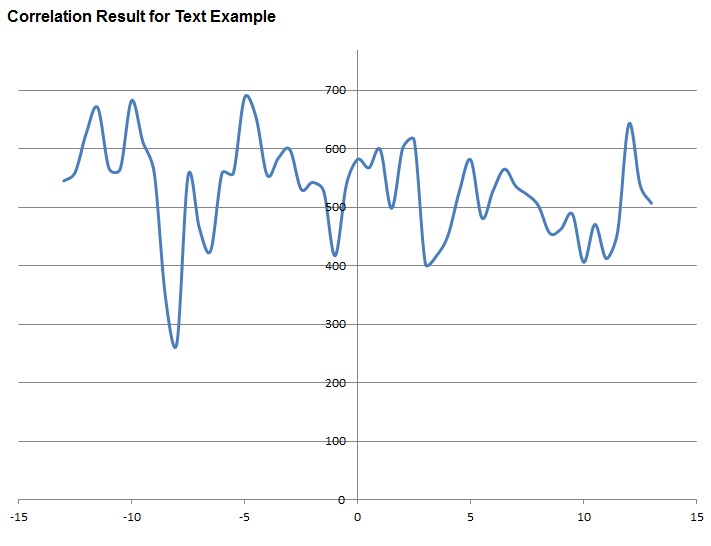
The minimum value on the curve is not dramatically lower,
but it is still readily identified.
We see that the best match is at C(-8). This means that
the 40-value window of Left line data, taken 8 sensels left of centered,
matches the 40-value window of Right line data, taken 8 sensels to the right of
centered. We conclude that the camera lens is out of focus, such that each
image is 8 sensels = 48um away from its in-focus reference position. The
autofocus system will respond by moving the lens focus closer until the images
match with no shift. If we repeated the correlation-curve plot afterward, we
would see the minimum value in the curve lands at 0 shift.
This is actually a difficult example, and the correlation
curve indication is rather weak. We can also have a look at the vertical-line
data and correlation, which will be much clearer.
For the vertical-line example, we still have a horizontal
line of text running through the AF point as before, but there is also a
horizontal line a little distance below it. This gives the vertical detection
lines two strong features to detect. For this case, I have reversed the shifts
(simulating front-focusing of the camera lens). Here are the plots of the
values read from the vertical detection lines:
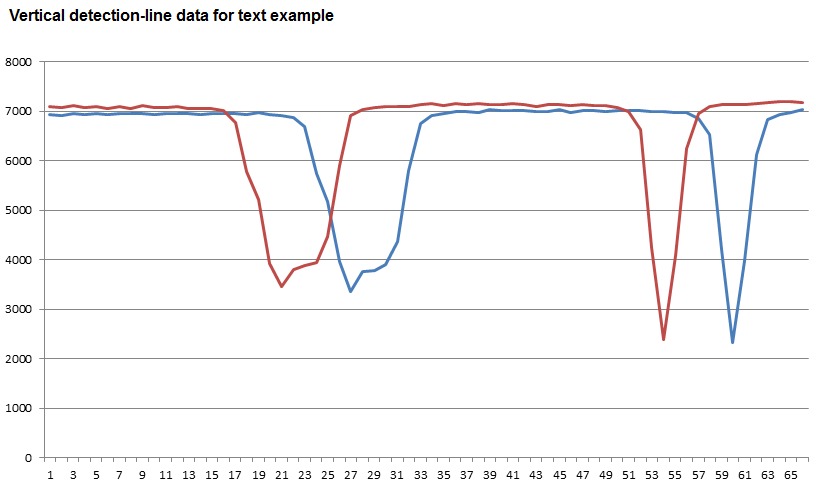
Two strong horizontal features within the AF point produce
very clear responses from the vertical detection lines.
The wide troughs correspond to where the line of text is,
and the narrow ones are from the horizontal line in the image.
Not surprisingly, the correlation plot gives us a much
more definite indication:
Match occurs at C(3).
This is what we like to see for a subject that allows
accurate AF. The only feature that threatens to make the conclusion less clear,
is the falloff at C(-13) and C(-12). This is due to the weak match found,
between the text and the horizontal line in the image.
In the following posts, we will take a look at some cases
that are potentially problematic, and also look at how well the AF system
handles blur (such as diffraction blur) and soft subjects.
The 2D Detection-line Model
Following
some experiments that I've been performing this week with my D3s AF system,
there are clearly some capabilities that could not be achieved with
a simple one-dimensional AF detection line that is the basis of my
original model.
To improve representation of the real system, I have
decided to upgrade my model to simulate a two-dimensional array of sensels in
the detection line, with staggered columns as suggested by the slanted
end-masking seen in the AF sensor photos.
The mask stagger is 15um total across the 120um width of
the detection lines. There is still a question of how many columns of
sensels lay within that 120um width; I have chosen a number of 5 for the model
because it is a good compromise between complexity and convenience of
collecting data for the model. This gives a shift of 3um for each column
of sensels (a possible direct match to the real detection lines), and if we use
the earlier approach of shifting just one test span at a time when performing
the calculations, the spatial resolution achieved will be 1.5um.
The Details
The model corresponds to detection lines with sensels that
are 24um wide and 15um high (referring to vertical detection lines). The
region on the lines that corresponds to each AF point will use an array of
sensels that is 5 wide by about 25 high. For performing correlation
calculations, the size of the test span will be 16 sensels high, and we will
shift it 6 sensels in each direction; the calculations thus will cover a total
span of 28 sensels which extends just a bit outside the region for each AF
point.
The calculations are performed for each of the 5 columns
of sensels independently. That is, each is treated as a separate
detection line with regard to correlations, because each column covers
different detail. The correlation results are then combined by a moving
window which takes 5 values at a time (one from each column) and this yields a
total of 121 points on the final correlation plot.
Pros and Cons of the 2D detection line
The approach of using wide staggered sensels, instead of
very narrow single sensels, works well for detail at most alignments (angles),
but loses the advantage of the stagger in the case where image lines are
angled to follow the stagger. In fact, this kind of rotational
alignment is one parameter that I will be investigating later. The
behavior, though, is often better than the one-dimensional line with narrow
sensels, which quickly loses contrast for image lines at most angles.
The large size of the sensels is an advantage for light
gathering and signal/noise ratio. However, it can also make very fine
details produce rather low-amplitude contrast, i.e., weak signals for the
correlation calculations to use.
Data Collection
The original model was intended to be used by taking image
samples from the AF module's "screen" that I have installed
in place of the AF sensor, so I was only using a 20x66 pixel strip from
the camera image. This of course is extremely tiny and results in low
resolution, as well as susceptibility to the texture of the AF module screen.
For the 2D model, I am taking image data from a direct
camera image instead, selecting an area which corresponds to the AF detection
line region for the AF point in use. Using the D800E, this is an
image strip of 110x420 pixels, which is then divided into 140
individual-sensel areas. The extraction procedure is more complex, but
has been automated to make it practical. It has the advantage that
defocus and diffraction effects can be directly set for study when
required, not to mention the convenience of being able to use any RAW image
file to provide samples.
Following posts will generally make use of the 2D model,
but there is one example using images directly from the AF module screen that I
would like to present; it will use the 1D model to illustrate a particular AF
system susceptibility.
Correlation with Defocus Blur; High-pass Filtering
As
photographers, we like to find contrasty, well-defined edges for our cameras to
focus on. It's natural to think that the AF system works best with such
subjects, and that it would have difficulty focusing accurately with very soft
edges.
But is this really true? If we think about how the
correlation works - matching two image samples point-by-point - it should be
able to match image samples that have gradual contrast transitions, as well as
sharp ones. After all, it's digitizing the tones to resolution that
should be sensitive to very small differences. A mismatch at gradual
transitions will not produce large absolute-difference terms, but then there
will be a relatively large number of terms that contribute.
In this example, I've run the 2D model on an image of
decorative printing on a pillow, with the image focused well at f/16, and then
defocused significantly. On the left is a plot of the detection line
values, and on the right, the result plot for the correlation runs.
Transitions are sharp for the in-focus case, but much smoother and more gradual
in the defocused case. However, the correlation plots are almost
indistinguishable, with just a small drop in amplitude for the defocused case:
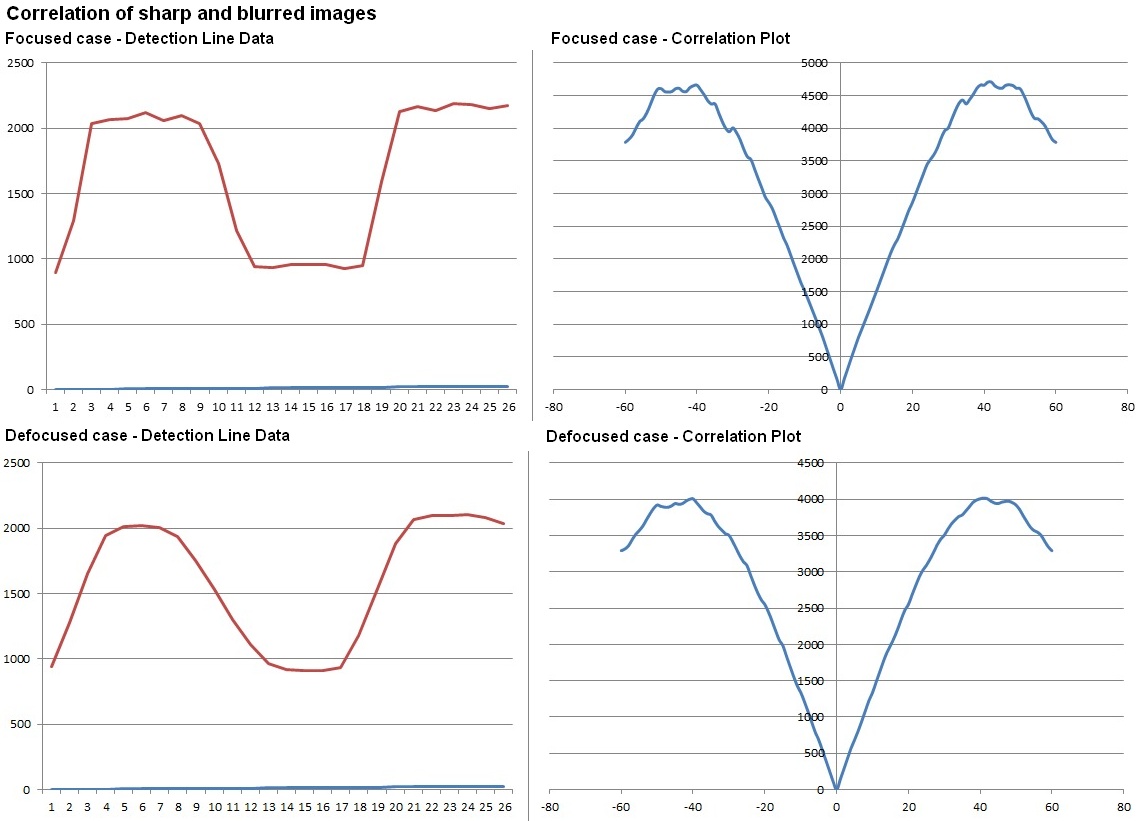
Clearly, the correlation plot for the blurred image is
indicating the shift for best focus just as well as the plot for the in-focus
image does.
This is actually an important capability, and demonstrates
how the AF system is able to accurately compute focus error when the camera
lens is far out of focus and the detail available to the AF sensor is quite blurred.
This also covers the relatively small amount of blur caused by diffraction -
even with the AF system's very "slow" aperture of about f/28 with
respect to diffraction effects.
One may wonder how much blur the AF system can work
with. Being the curious sort, I ran some experiments with my D3s, and
then discovered a surprising result. As long as the subject contrast
included within the selected AF point is high enough, blurred edges allow the
camera to lock focus fairly easily; this is in line with expectations, knowing
how the correlation works. However, if I used a soft edge with limited
contrast range, AF was not possible.
High-pass Filtering
There must be some processing of the detection-line data,
to remove constant bias, and even compensate for gradual falloff in the image,
across the AF point. This would be high-pass filtering, so that there is
effectively an upper limit to the size of detail that can be
used for focusing.
This would make sense, to prevent problems when the
AF-sensor images start to vignette as can happen when lenses close to the
minimum f/8 speed are used. Such vignetting would produce a tonal falloff
in the images projected onto the AF sensor, which runs in opposite directions
for the two images in each pair.
For example, on the vertical detection lines, the upper
image would darken more at the top and the lower image would darken more at the
bottom. This creates a mismatch between the images, which
could swamp the image details we want the correlation calculations to find
- especially if the subject does not have high contrast.
I ran some simulations of this, using the 1D model.
Even given a subject with good contrast, I found that adding some tonal falloff
(running opposite directions on the opposite detection lines) and
image-brightness discrepancy can significantly degrade the correlation
plot. Here is an example which uses the same test image that I used
in some earlier posts, taken directly from the AF module screen. The
upper plot is the original one, without any image vignetting, and the lower
plot is the result after some vignetting and bias has been artificially
introduced into the data:
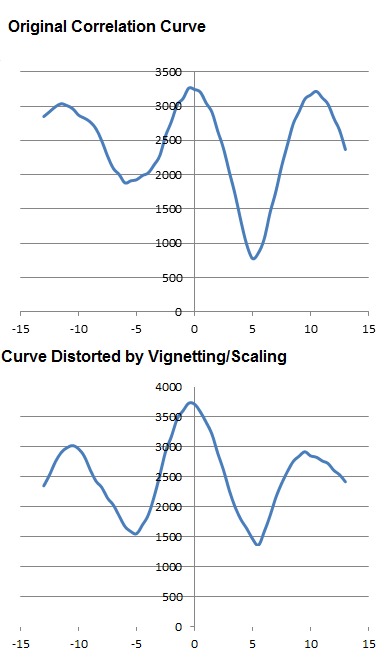
Without high-pass
filtering of the detection-line data, vignetting of AF-sensor images can
corrupt the correlation plots.
The upper curve is clearly indicating the focus shift, but
the lower curve has been distorted and has a second trough that could result in
complete mis-focus, if the image contrast had been a little lower. Even
the original trough at +5 has been shifted slightly to the right, which would
reduce focus accuracy. High-pass filtering of the detection-line data
will prevent these problems.
In an upcoming thread which investigates AF system
capabilities and limits, I will revisit the topic of focusing on soft subjects.
Problematic Periodicity
Regular
repeating patterns present one of the most common problems for phase-detect AF,
and can cause severe mis-focus. Often, they will present the AF system
with several choices for focus, all of which appear to be valid according to
the correlation plot.
Here is an example, with the image data extracted from a
photo of a ribbed knit band that has very consistent spacing between the ribs:
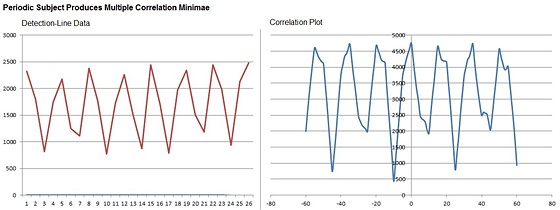
Regular patterns in the subject (left) can produce a
correlation plot with multiple troughs.
This correlation plot will give the camera four good
choices to select from. The overwhelming tendency is for the AF
system to choose the one that has lowest shift, i.e., the nearest choice.
The photographer can guide the camera to the desired focus by
pre-focusing manually before engaging AF. Because the troughs are deep
and narrow, the camera is able to achieve very precise focus lock, i.e., the
presence of the alternative focus choices does not degrade focus accuracy for
the selected option.
Fortunately, only subtle departures from regularity in the
pattern can give the camera enough information to select the
"correct" focus without manual guidance from the operator. In
the next example, slight shading near the center of the pattern gives it an
overall contour which improves the correlation plot. There are only two
good choices remaining for the camera to select from; in actual operation with
this subject, there was a very strong tendency to select the
"correct" option, and the alternate was only chosen if the lens was
pre-focused all the way down to its minimum focus distance:
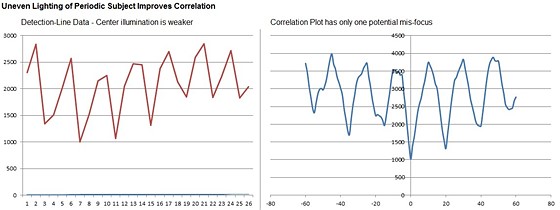
Uneven lighting takes some of the "alternative"
focus positions out of consideration.
Minor Details Provide Major Assistance
Some subjects may contain strong repeating patterns,
but include enough small irregular detail to allow the camera to find focus
very dependably. In the next example (see inset), a bar-code pattern has
four heavy black bars which are almost evenly spaced, and the overall pattern
is almost symmetrical, but the correlation plot shows that correct focus will
be easily achieved:
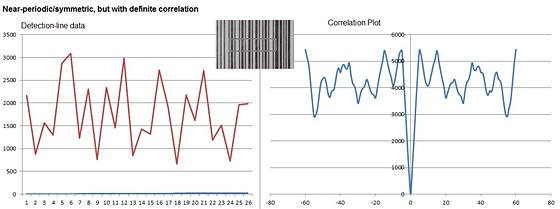
Small irregularities in an otherwise repeating pattern give
the AF system good focus discrimination.
To Summarize - Focusing on Regular Patterns
Manual pre-focus provides good guidance for the AF system
to select desired focus.
When AF is guided to select the desired alternative,
focus precision is typically very high.
Relatively minor irregular features can provide adequate
guidance for the AF system to select correct focus and reject alternative focus
positions.
Resolution Limit
What
is the finest detail that the AF system can detect?
Due to its very "slow" aperture - about f/28
with regard to diffraction effects - the AF system's optical resolution limit
is primarily set by diffraction.
Coming up with a good figure for the Airy disc size is not
quite straightforward, due to the odd shape of the area on the camera-lens exit
pupil which the AF system takes its light from:
Size and shape of apertures for the AF system, at a typical
main-lens exit-pupil distance
We can start by calculating the Airy disc
size for a circular aperture with the same diameter as the minor
diameter of the hex-shaped apertures. This is 3.0mm, at a distance of 106mm
from the field lens, giving us f/35. The Airy disc diameter for a circular
aperture will be 47um.
Due to the rather straight sides and extra width of the
AF-system apertures, we can justifiably take out the 1.22x correction factor
that is used for circular apertures, giving an Airy disc diameter of 39um. The
shape of the Airy disc will not be quite circular; the wide aperture shapes
will reduce the diameter of the Airy "disc" somewhat in the
tangential direction. Since we are interested in the extent of the Airy disc
along the length of the AF detection lines, though, we want to use the larger
39um figure.
The 39um Airy diameter at the field lens is reduced by the
low magnification of the separator lenses, to slightly less than 9um at the AF
sensor chip. Since there are some additional small contributions to diffraction
from the separator lenses, we will take 9um as the effective size.
Diffraction Blurring
To give the calculations a more precise meaning, let us
assume that as a test subject, we are using 50/50 white/black bars such as are
typically used for lens resolution tests. We need to compute the effect of
diffraction on the contrast of such bars. This is not straightforward, but can
be readily evaluated by using my Vcam application. I calculate percent contrast
as 100 * (Max - Min)/(Max + Min) where Max and Min are the highest and lowest
tonal values in the projected image, as given by Vcam.
Let T be the spatial period of the white/black bars, i.e.,
the total width of one white bar plus one black bar, which is also called one
"cycle." Let Da be the diameter of the Airy disc. Contrast is then
determined strictly by the ratio of Da/T; as Da increases relative to T,
contrast decreases. When Da becomes large enough relative to T (or T becomes
small enough relative to Da), all detail in the projected bars is completely
lost, i.e. contrast goes precisely to zero and the projected image is a flat
medium gray.
This behavior is universal to all sorts of optical
testing, so the figures provided below are very useful in estimating
diffraction effects when they dominate resolution in lens testing (the ratios
have funny values since they follow some common apertures for a particular
case):
|
Da/T
ratio |
Contrast |
|
0.28 |
96% |
|
0.39 |
91% |
|
0.78 |
80% |
|
1.11 |
60% |
|
1.27 |
50% |
|
1.54 |
35% |
|
1.84 |
20% |
|
1.95 |
15% |
|
2.24 |
5% |
|
2.55 or
higher |
0% |
Since our Da value is 9um, we see that having T at 7um
would give us 50% contrast, or having T at about 4.5um would give us 15%
contrast. The latter is commonly taken as lowest-acceptable contrast in optical
systems.
If the detection-line design follows the assumption used
for the 2D model, the combined spatial resolution of the sensels is 3um, which
would be the widest sampling period that one wants to have for signal periods
down to T=6um. Thus we see that the detection-line spatial resolution matches
very nicely with a point on the contrast curve where there is still good usable
contrast; the system should be able to "see" test bars at periods
around 6um, across a wide range of lighting.
Experiments with my D3s verify that this is about the
limit of the AF system. To put this into perspective for a user, this
corresponds to having about 40 line pairs within the height of the AF-point box
in the viewfinder display, or about 55 line pairs across the width of the
AF-point box. Under bright lighting, this may improve slightly, but the
extinction limit occurs at about 65 line pairs vertically or 90 line pairs
horizontally within the AF-point box, and this limit can only be approached -
never fully achieved.
Counting Photons: Optical Gain and Noise
With
today's AF systems rated down to about LV -2, I thought it would be a good idea
to take a look at the amount of light available to the AF sensor at such low
illuminations.
I will take a two-step approach which first estimates the
photon flux available to the D300 imaging sensor, then calculate the gain
scaling relative to that, to arrive at the photon flux for the AF sensels.
The camera's meter will be used as a reference, not
because this is the most accurate approach, but because of its practicality to
photographers. We then take our definition of LV -2 to be that light level
which produces a nominal exposure reading when the camera has been set to ISO
1600, f/2.8 and 2 sec exposure time; this is equivalent to ISO 100, f/1 and 4
sec.
By taking measurements from the RAW file under the above
conditions, then compensating for the sensor QE figure (per sensorgen.info), we
find that there is a flux of about 400 photons per second to each D300
green-channel imager sensel. Since this is after the color filter, we need to
compensate for filter loss, giving a conservative estimate of 500 photons per
second without the filter.
Geometry
The AF system has the field-lens mask positioned typically
106mm behind the main lens exit pupil, and at this distance, it takes light
from a small patch of the main lens exit pupil that is 12.5 square mm. All of
the light from this patch that passes through the field-lens mask, ends up
within an image area at the AF sensor which is 1.88mm high by 1.16mm wide. This
area (taking the sensel size of 24um by 15um as used in the 2D model discussed
previously) is equivalent to 6060 AF sensels, so if we call the total light
flux (from the main-lens patch that is collected by the field lens) T
(photons/sec), then each AF sensel receives T/6060. However, in the camera this
is reduced by the beam-splitter mirror; if we take an estimate of 35% for
transmission through the mirror, each AF sensel will receive T/17300.
For the main image sensor, let's start with the same 12.5
square mm patch on the lens exit pupil. The image sensor is around 6mm closer
to the lens, than the AF system's field lenses, so taking the light projection
angle that matches the field lens size, the photon flux T will be shared by
some 1.26 million D300 imager sensels (corresponding imager area is 7.9mm by
4.8mm). Now we scale up according to the exit-pupil size of an f/2.8 lens,
which is 80x the area of the patch used by the AF system: Each D300 imager
sensel receives a photon flux of T/15700.
Finally, taking the ratio of AF-sensel flux to
imager-sensel flux for the above case, we have (T/17300)/(T/15700) which is
91%. That is, each AF sensel receives 91% as much photon flux as the
imager sensels do, when the latter are operating behind an f/2.8 lens.
From the estimate given above, at LV -2 with an f/2.8
lens, there is a flux of 500 photons per second arriving at each imager sensel,
so we expect a flux of about 450 photons/sec for each AF sensel. [Note that
although we "used" an f/2.8 lens for the calculations, we could just
as well have used other apertures, and would still arrive at the figure of 450
photons/sec for the AF sensels.]
Shot Noise
The D300 is capable of 8 frames/sec, so the upper limit
for integration time in the AF system may be only as much as 60msec. At
450 photons/sec, this means each AF sensel will only receive 27 photons at LV
-2. Allowing for quantum efficiency, the signal/noise ratio considering
just shot noise would be only about 4.5.
In the presence of such rather high noise levels, we can
appreciate that subjects at LV -2 need good contrast, so that noise will not
swamp the signal available for the correlation calculations.