Olympus Sensor Calibration as
Compared with DxOMark Measured ISO
Prepared 2019-02-09, revised 2019-02-10 by Bill Claff
For many cameras Olympus stores Sensor Calibration
information in their raw files as tags in the Exif MakerNote.
In this article I'll compare those values with measurements from DxOMark for
what DxOMark calls "Measured ISO".
Analysis
We can use a program like Exiftool to get Sensor Calibration
information out of Olympus ORF files.
Here's are the key tags from an Olympus OM-D E-M1 ORF (or DNG) at ISO 100:
Black Level 2 : 255 255 255 255
Sensor Calibration : 4094
646
We locate the Olympus middle gray as follows (the values used are in bold above):
646 / (4094 - 255) @ 16.8273%
I this article I'll only consider the 2nd Black Level 2
value which is for one of the green channels.
In general the Black Level 2 values are identical or quite close across all
four channels.
For this camera and ISO setting the DxOMark value for
Measured ISO is ISO 122.
DxOMark appears to use L50 adjusted by 1/2 stop as their standard.
L50 is 18.4187% (commonly rounded as simply 18%) so this works out to 13.0240%
as their middle gray standard.
We locate the DxOMark middle gray for our example data-point as follows:
((Measured ISO) / (ISO setting))
* (L50 adjusted by 1/2 stop) or
(122 / 100) * 13.0240% @ 15.8892%
It's helpful to treat our values as stops from middle gray:
Olympus is log2(16.8273%
/ 13.0240%) @ 0.37 stops and
DxOMark is log2(15.8892% /
13.0240%) @ 0.29 stops.
The difference of 0.08 stops or about 1/12 stop is pretty good agreement.
I computed both Olympus Sensor Calibration and DxOMark Measured ISO values for all ISO values for the following cameras measured by DxOMark:
- Olympus OM-D E-M1
- Olympus OM-D E-M1 Mark II
- Olympus OM-D E-M10
- Olympus OM-D E-M10 Mark II
- Olympus OM-D E-M5
- Olympus OM-D E-M5 Mark II
- Olympus PEN EP1
- Olympus PEN EP2
- Olympus PEN EP3
- Olympus PEN E-P5
- Olympus PEN EPL1
- Olympus PEN EPL2
- Olympus PEN EPL3
- Olympus PEN E-PL5
- Olympus PEN E-PL7
- Olympus PEN EPM1
- Olympus PEN E-PM2
- Olympus PEN-F
- Olympus Stylus 1
- Olympus XZ-2 iHS
The only camera I had to omit was the Olympus XZ-1 due to invalid Olympus
values (probably due to a firmware bug).
This bubble chart gives us a good indication of how well
these values agree:
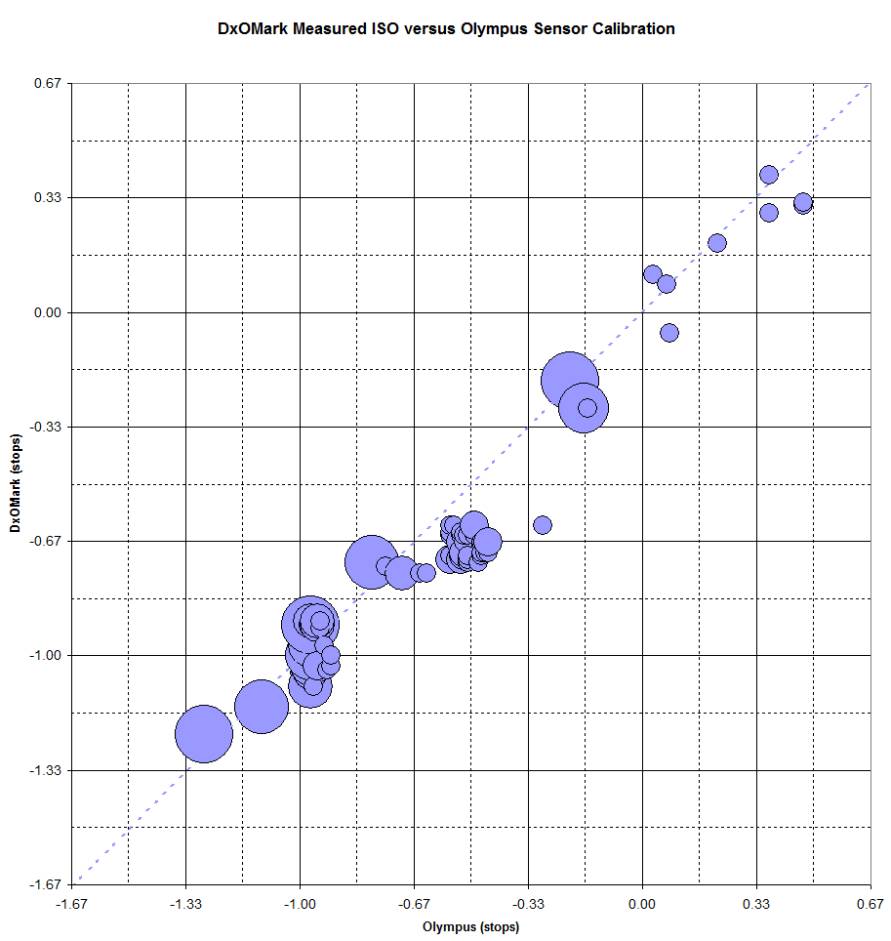
Although the values are quite close there is a tendency for
the DxOMark values to be slightly lower than the Olympus values.
In particular there is a cluster of values at around -1/2 for Olympus and -2/3
for DxOMark.
This trend can be see more clearly in the bar chart:
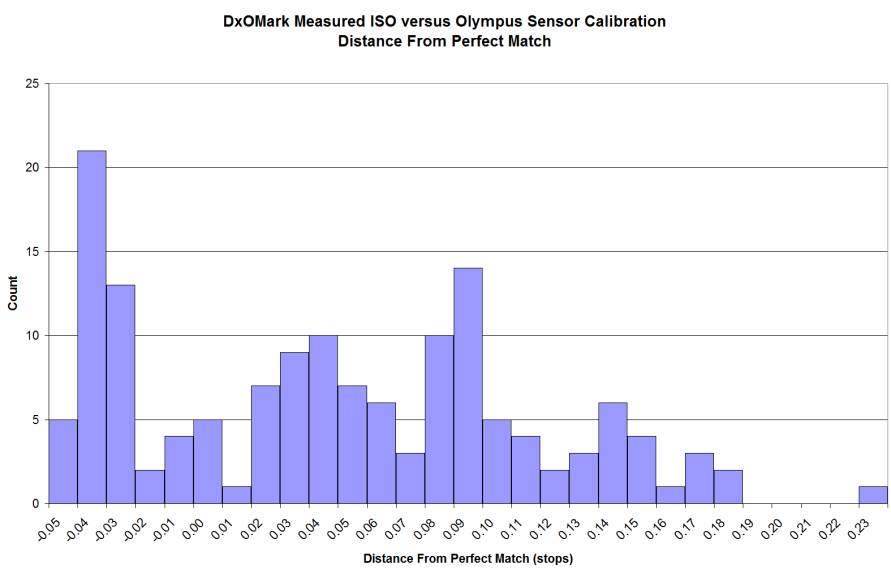
Here distance from perfect match is the distance from a data-point to the
line formed by y = x (the dotted line in the bubble chart).
Although this looks heavily skewed, the average value is only about 0.04 which
is 1/25 of a stop.
Conclusion
DxOMark Measured ISO and Olympus Sensor Calibration are in
pretty close agreement.
Assuming that we should treat the Olympus value as authoritative it appears
that DxOMark has a slight tendency to report lower values.
Furthermore we observe that in general Olympus Sensor
Calibration is about 1/2 to 1 stop below L50 adjusted for 1/2 stop headroom.
In other words Olympus provides 1/2 to 1 stop of highlight protection in
exchange for a corresponding loss in the deep shadows.
This doesn't affect dynamic range but could affect comparisons of low light
performance with other camera brands depending on their sensor calibration.