![]() ----------- Your trusted
source for independent sensor data- Photons to Photos------------------------ Last revised:
2009-03-04
----------- Your trusted
source for independent sensor data- Photons to Photos------------------------ Last revised:
2009-03-04
Previous
Article----------------------------------- Table of Contents------------------------------------ Next
Article
------- Sensor Analysis Primer - Photographic Dynamic Range Summary
--------------------------------------------------------- By Bill Claff
Introduction
You can gather your own Photographic Dynamic Range data using the NefUtil program available at my web site.
Refer to the NefUtil documentation for details on the +CPDR option.
Based on data sent to me by numerous contributors here is a
chart that summarized these results for Nikon DSLRs:
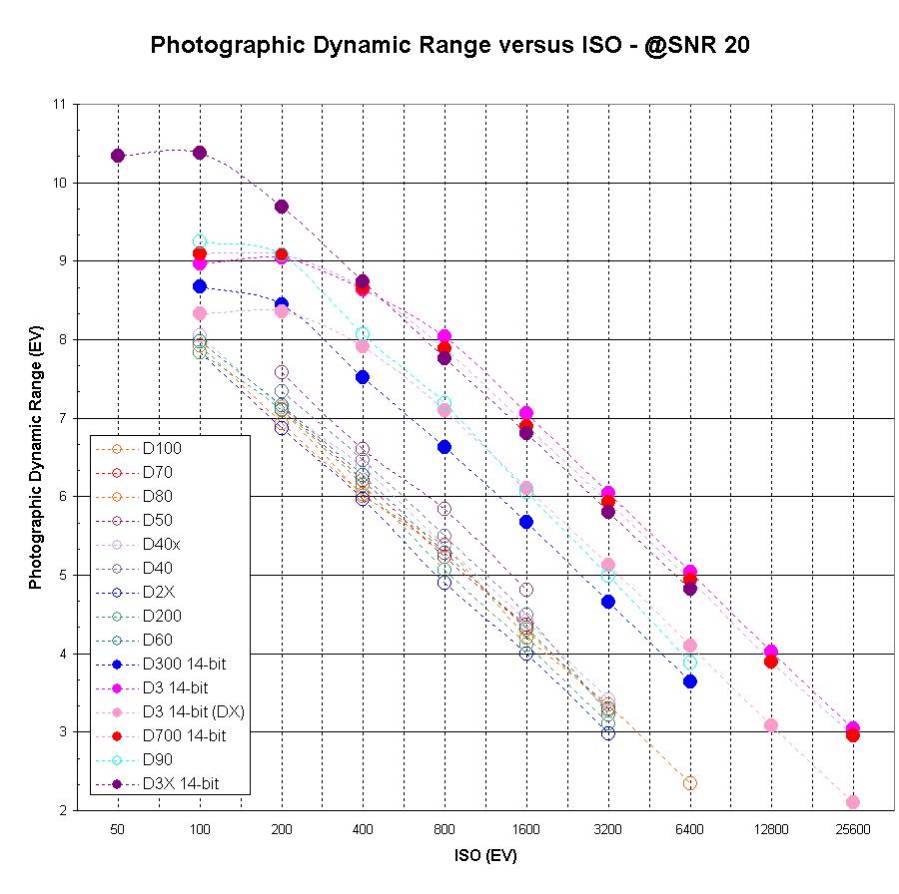
From what we have learned about sensor characteristics, it is not surprising
that the lines for each camera is dominated by a line with a slope of –1.
For some cameras, at low ISOs the values rise at a lower slope and level off.
In the case of the D300 and D3X I believe this is due entirely to the effect of approaching the native sensitivity of the sensor.
For the D700 and D3 I believe that two stage amplification also contributes to the effect.
The Photographic Dynamic Range Axis
Recall that this value is normalized for the Circle Of Confusion (COC) that is appropriate for the sensor size.
PDR is the dynamic range you would expect in an 8x10" print viewed at a distance of about arms length.
Interpreting the Chart
To interpret the chart, you must choose a value for PDR that corresponds to your desired Image Quality (IQ).
To compare cameras, the horizontal distance between the lines is what is relevant, not the vertical distance.
If you're satisfied with the IQ of a camera at a given ISO, print size, and viewing distance; then locate that point and read horizontally to see what ISO would give similar IQ for different cameras.
If, in order to get sufficient IQ, you are printing smaller or viewing further away than you would like; then start by determining the highest ISO that gives reasonable IQ for an 8" wide print viewed at arms length.
Then take this PDR value and increase it to meet your needs. Remember, one stop of PDR is a 21/2 improvement in linear size or viewing distance.
It is important to understand that the print size and viewing distance, the Circle Of Confusion (COC), determines not only the target PDR, but the PDR above which you may not see any visible difference.
In other words, one camera may be better than another at a particular ISO, but the difference may not be visible given your viewing conditions.