Sony A7RM2 DR-Pix Read Noise
Prepared 2015-08-29 by Bill Claff
This article presents analysis results only. For background
see Sony A7S DR‑Pix Read Noise.
The Sony A7RM2
This table summarizes the
calculations for all of the ISO settings:
|
|
model |
measured |
||||||
|
ISO |
pixel |
conversion |
conversion |
intermediate |
conversion |
conversion |
read |
read |
|
Setting |
noise |
gain |
noise |
noise |
gain |
noise |
noise |
noise |
|
|
e- |
e-/e- |
e- |
e- |
DN/e- |
DN |
DN |
DN |
|
100 |
0.925 |
1.000 |
2.906 |
3.050 |
0.315 |
1.223 |
1.555 |
1.413 |
|
125 |
0.925 |
1.000 |
2.906 |
3.050 |
0.397 |
1.223 |
1.721 |
1.666 |
|
160 |
0.925 |
1.000 |
2.906 |
3.050 |
0.500 |
1.223 |
1.955 |
1.964 |
|
200 |
0.925 |
1.000 |
2.906 |
3.050 |
0.630 |
1.223 |
2.277 |
2.329 |
|
250 |
0.925 |
1.000 |
2.906 |
3.050 |
0.794 |
1.223 |
2.712 |
2.778 |
|
320 |
0.925 |
1.000 |
2.906 |
3.050 |
1.000 |
1.223 |
3.286 |
3.357 |
|
400 |
0.925 |
1.000 |
2.906 |
3.050 |
1.260 |
1.223 |
4.032 |
4.045 |
|
500 |
0.925 |
1.000 |
2.906 |
3.050 |
1.587 |
1.223 |
4.993 |
4.918 |
|
640 |
0.925 |
6.350 |
2.906 |
6.553 |
0.315 |
1.223 |
2.399 |
2.418 |
|
800 |
0.925 |
6.350 |
2.906 |
6.553 |
0.397 |
1.223 |
2.874 |
2.940 |
|
1000 |
0.925 |
6.350 |
2.906 |
6.553 |
0.500 |
1.223 |
3.497 |
3.555 |
|
1250 |
0.925 |
6.350 |
2.906 |
6.553 |
0.630 |
1.223 |
4.305 |
4.356 |
|
1600 |
0.925 |
6.350 |
2.906 |
6.553 |
0.794 |
1.223 |
5.343 |
5.318 |
|
2000 |
0.925 |
6.350 |
2.906 |
6.553 |
1.000 |
1.223 |
6.666 |
6.737 |
|
2500 |
0.925 |
6.350 |
2.906 |
6.553 |
1.260 |
1.223 |
8.346 |
8.433 |
|
3200 |
0.925 |
6.350 |
2.906 |
6.553 |
1.587 |
1.223 |
10.474 |
10.310 |
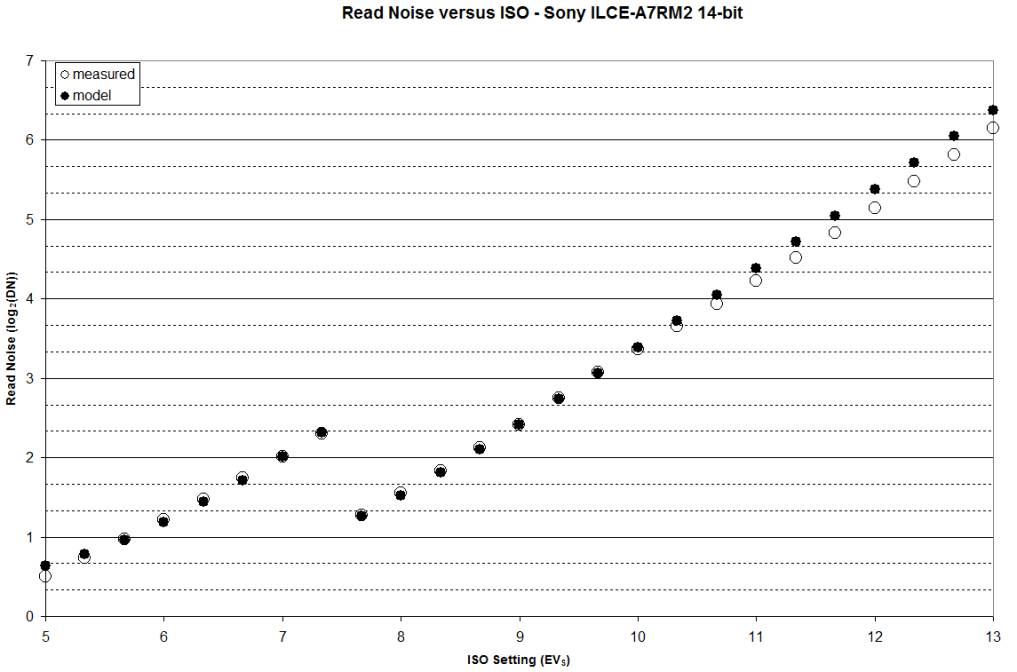
You can see by examining the table or the following chart that the model read
noise and the measured read noise agree quite well.
(This is a log-log chart and the small discrepancies are generally well within
a 1/6EV tolerance.)
However, agreement above ISO 3200 diverges as if there is a small amount of
noise reduction. This is still under investigation.
Conclusion
I have demonstrated that to
characterize read noise of the A7RM2, incorporating DR-Pix technology, that
only three values are required: 0.925e- pixel noise, 2.906e- pixel conversion
noise, and 1.223DN ADC conversion noise. (And unity gain of 318 to compute the
conversion gains to feed in.)
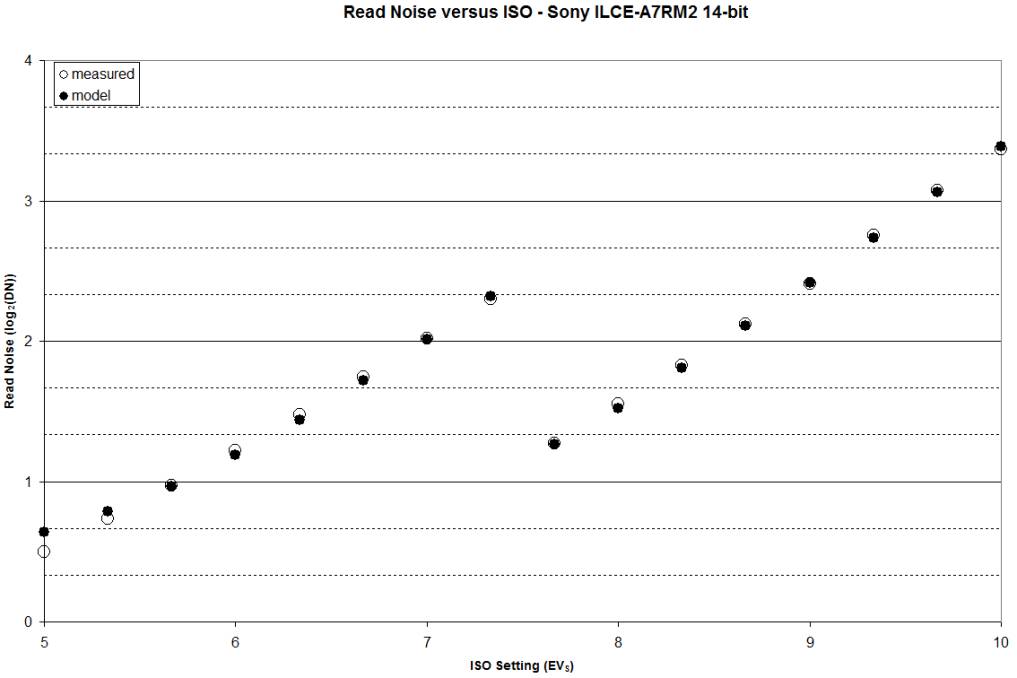
Addendum
This chart shows graphically how
measured read noise (in DN) drops steadily below the model above ISO 3200 (EVS
10)